


Ecology of West Nile virus in New York City
Vector-borne diseases in urban environments are a major public health issue in the developing world. The outbreak of West Nile virus (WNV) in New York City (NYC) in 1999 revealed that even affluent societies are not invincible to emerging diseases. Global climate change is predicted to exacerbate this problem. Although there is a great body of knowledge about the biology of vector-borne diseases (including WNV) and transmission dynamics in rural and semi-rural landscapes, the urban ecology of such diseases is poorly understood. Particularly lacking is a comprehensive understanding of how the built environment directly and indirectly affects transmission, spread, and evolution and how urban environments under anthropogenic influence affect disease dynamics. This study used surveillance data from outbreaks of WNV in New York City between 1999 and 2006 to explore three hypotheses:
- Spatial variation in the built environment leads to percolation-like spread rather than wave-like spread of classical epidemic models.
- The pattern of annual outbreaks is explained by the interaction of seasonal temperature fluctuations and random variation in precipitation with a dynamical infection process.
- Evolution to avirulence to humans is a byproduct of evolution toward avirulence in birds and/or adaptation in mosquitoes.
We used a combination of GIS, statistical pattern recognition and dynamical systems models to address these hypotheses using New York City as a representative system. Issues of wider generality include seasonal forcing of disease transmission (a process which is also important for avian and human flu and numerous wildlife diseases), transmission in urban environments, and circulation of multi-vector multi-host pathogens.
Results
Decelerating spread of WNV in NYC
Standard reaction-diffusion models predict that pathogens spread as waves with constant or increasing speed. In contrast, we show that West Nile virus showed significant decelerations at its North American epicenter in New York City. Geostatistical analysis showed that WNV-positive dead birds were found in a significantly lower proportion in high-intensity developed land-cover type (>85% impermeable surfaces), which comprises 41.41% of New York City, compared to other land-cover types. Spatial models in physics have shown previously that heterogeneity can prevent spread (e.g. flow of fluid) when the proportion of connected sites is below a specific percolation threshold. Using numerical simulations, we found that spatial heterogeneity in the vicinity of the percolation threshold can lead to the pattern of decelerating wave that we found in NYC. The proportion of land-cover types with relatively high WNV-prevalence is 59.93%, barely above the percolation threshold of 59.27%. These results suggest that targeting control at sites conducive of WNV transmissioncould efficiently prevent pathogen spread to remote susceptible areas.
Using Birds as an Indicator of Spatio-temporal Distribution of WNV in NYC
Sarah Bowden, an undergraduate researcher in our lab, is using a specific machine learning algorithm, boosted regression trees, to investigate how the intensity of West Nile Virus (WNV) infection in wildlife depends on environmental variables such as current and past rainfall and temperature. This activity is part of an effort to develop a weather-based early warning system for WNV by identifying meteorological patterns relevant to WNV transmission, specifically in New York City. The intensity of WNV infection is estimated by the weekly increase in the number of WNV-positive dead birds and mosquito pools. Boosted regression trees work by combining hundreds of regression trees to successfully predict the dependent variable based on a long list of predictor variables. Boosted regression trees for the intensity of WNV infection in mosquito pools were able to explain about 60% of the variation in the data, with current temperature and temperature 6 and 5 weeks ago as the most important predictor variables.
Regional differences in the association between land cover and West Nile Virus incidence in humans in the United States
Numerous studies have reported correlations between different land cover types and WNV incidence in humans, and seroprevalence in birds, mosquitoes, and wild and domesticated mammals (primarily horses). However, the strength and sign of these correlations has varied considerably. Therefore, it is not clear how land cover associates with WNV incidence in different regions of the country, as well as in the U.S. As a whole. We sought to clarify this relationship by analyzing the sign of the association between human WNV incidence and land cover at two spatial extents in the continental U.S. In general, we found that WNV incidence in Northeastern regions was positively associated with urban land cover, whereas WNV incidence in Western regions was positively associated with grassland and crop land cover. We submit that the difference in the habitat association of the prominent mosquito vectors in these two areas (Culex pipiens in the Northeast and Culex tarsalis in the West) is the probable driver for these regional trends.
- Bowden, S., K. Magori & J.M. Drake. 2011. Regoinal differences in the association between land cover and West Nile virus incidence in humans. American Journal of Tropical Medicince and Hygiene 84:234-238.[pdf] [online]
- Magori, M., W.I. Bajwa, S. Bowden & J.M. Drake. 2011. Decelerating spread of West Nile virus by percolationi in a heterogeneous urban landscape. PLoS Computational Biology 7:e1002104 [pdf] [online]
- Drake, J.M. 2009. Evolutionary relationships among human-isolated and wildlife-isolated West Nile viruses. Infection, Genetics and Evolution 9:1392-1393. [online] [pdf]
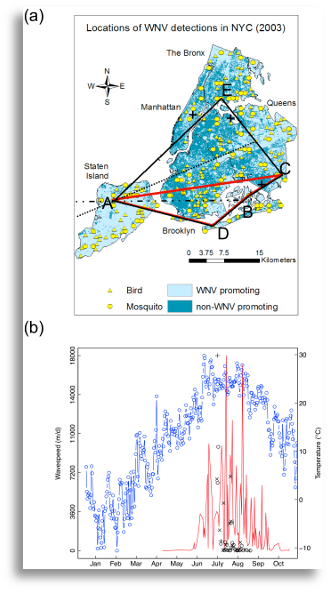 The spatial structure of annual WNV outbreaks in NYC, demonstrated for the year of 2003.
(a) Speed of WNV spread was estimated from point locations of WNV-positive mosquito pools (circles) and WNV-positive dead birds (triangles). Dark and light cyan areas represent transmission-inhibiting and transmission-promoting land-cover types. The black crosses represent the approximate location of Central Park, La Guardia Airport and the John F. Kennedy International Airport respectively, where NOAA collects weather data. The first five locations where WNV was detected in 2003 are labelled as A,B,C,D and E, respectively. The first estimate of wave-speed was calculated using the convex hull method as (1) the increase of the square root area of the polygon encompassing ABCDE (black) relative to the square root area of the polygon encompassing ABCD (red) locations (convex hull method); (2) the difference between the average length of the two transects from A (ultrafine dashed and dash-dotted) intersecting the polygon ABCDE and the length of the transect (dash-dotted) intersecting the polygon ABCD (boundary displacement method); (3) the increase of the maximum distance between AC and AB (maximum distance method), divided by the time elapsed.
(b) Estimated speed of WNV spread (black, in meters d−1), based on the convex hull method (circles), the boundary displacement method (symbol X ) and the maximum distance method (crosses), respectively; mean daily temperature (blue), and the total daily number of mosquitoes collected (red) over time.