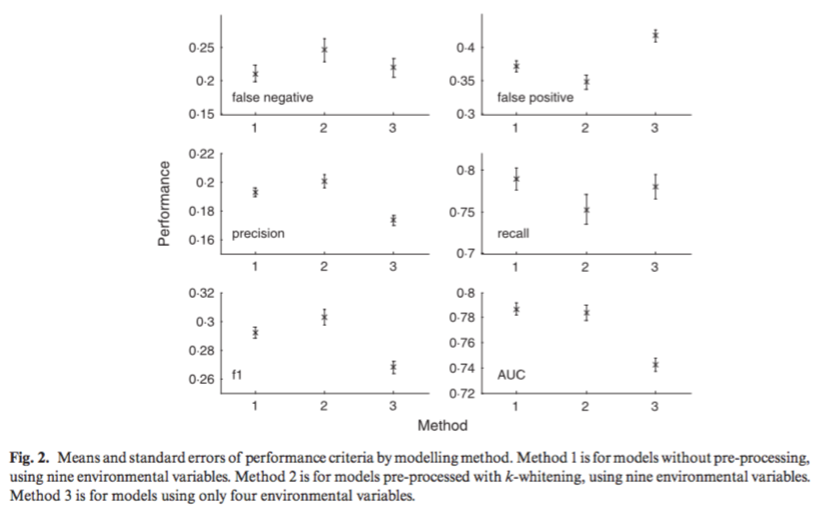
Drake, Randin, & Guisan (2006) tested the method of support vector machines (SVMs) to map ecological niches using presence-only data for 106 species of woody plants and trees in a montane environment with nine environmental covariates. Support vector machines (SVMs) utilize machine-learning techniques designed to model one type of data only by finding statistical patterns and then removing outliers to estimate the support of high-dimensional distributions. The support of the distribution of a species’ environmental requirements is analogous to Hutchinson’s ecological niche concept. In situations with presence-only, SVMs are simpler (and differ from other methods) because they eliminate the requirement for pseudo-absence data. This paper compares three ways of using the SVM approach: (1) using no pre-processing or data reduction to the nine environmental covariates, (2) pre-processing training data using k-whitening, and (3) restricting covariates by removing highly correlated environmental variables. They found that method 1 resulted in models with the highest recall (ratio of number of correct predictions to total number of observations) and lowest false positive rate. Method 3 performed the worst overall, suggesting that useful information about ecological niches can be obtained by the inclusion of more environmental variables, even if they are highly correlated. Additionally, they found that the SVM method required approximately the same amount of observations as comparable methods, and resulted in similar AUC values for prediction. This paper helped to develop a background understanding of the literature on machine-learning techniques to model presence-only vs. presence-absence data and how the aforementioned methodological differences determine whether a species’ fundamental or realized niche is being modeled.
Drake, J.M., RANDIN, C. & GUISAN, A., 2006. Modelling ecological niches with support vector machines. Journal of Applied Ecology, 43(3), pp.424–432.
