The author of this paper puts forth the idea that evaluation of machine learning algorithms can be evaluated by employing receiver operator curves and determining the area under said curves. The problem outlined in this paper is how to effectively evaluate the performance of a model that is trained on provided examples. In this paper the author introduces a technique for estimating the area of the curve, and demonstrates how effective the proposed technique is by using data from six case studies.
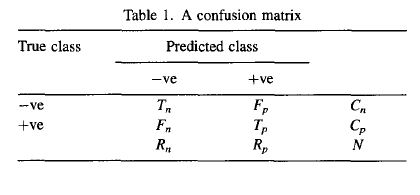
ROC curves are related to the confusion matrix table.

In the confusion table Tn represents the True negative rate, Fp represents the false positive, Fn represents the false negative rate, and Tp represents the True positive rate. Summing across the rows we have Cn which is the True negative number, CP the True positive number. For column sums we have the Predictive negative (Rn) and Predicted positives (Rp). From these numbers we can evaluate the classifier with the following summary statistics: accuracy, sensitivity, specificity, positive predictive value and negative predictive value.
Bradely points out that all of the measures mentioned above are only valid for a specific threshold point, and that estimating the area under the curve from ROC curves would overcome this drawback. Another technique presented here is how to determine the standard error for AUC estimates.
The datasets considered in this paper revolve around health outcome diagnosis with two output classes. Machine learning methods evaluated are the following: quadratic discriminant function, multiscale classifier, k-nearest neighbor, C4.5, perceptron, and multi-layer perceptron.
A key finding of this paper is demonstrating how AUC estimates are similar in their application to the Wilcoxon rank statistic (Section 9.3.1). For a more indepth summary of the results refer to the figures provided within the manuscript.
