Ficetola, Gentile Francesco, et al. “How many predictors in species distribution models at the landscape scale? Land use versus LiDAR-derived canopy height.” International Journal of Geographical Information Science28.8 (2014): 1723-1739.
Link
In this study researchers employ an approach to better evaluate which features of the landscape, mainly those measured by remotely sensed tools, are important for a selected bird sanctuary in the Netherlands. They define their study as being small with no variability in climatic or topographic gradients, which provides reason to suggest that features of the landscape are driving species distribution. Using data collected from a Biodiviersity Multi-SOurce Monitoring System: From Space to Speices (BIO_SOS) project, researchers compared the performance of five different models in explaining species distribution provided a fine scale study area.
Models
- Models using a relatively large number of traditional land-use variables
- Models using a small number of land-use variables
- Models excluding land-use variables, and only using canopy height collected via LiDAR sensors
- Models using a large number of land-use variables and LiDAR
- Models using a small number of land-use variables and LiDAR
Occurrence data was collected within the Veluwe located in the Netherlands, the Veluwe is roughly equivalent to a national park found within the United States. Land-use/land-cover data sets were collected through the Dutch government, and the likely satellite system used to collect the base images were Landsat. Seven classified habitats were included in this study: broadleaved forest, coniferous forest, heathland, grassland, sparse vegetation, built-up, and shifting sand. The study area was partitioned into 20 m x 20 m cells, and for each cell researchers measured the average cover of habitat within a 100 m radius from the cell center. LiDAR data was also attributed to cells in the same way.
For Analysis, researchers first determined the correlation coefficients between independent variables with |r| >0.7 as a cut off. They also used a variance inflator factor to determine whether multicollinearity occurs in developed models. MaxENT models were built for predicting species distribution.
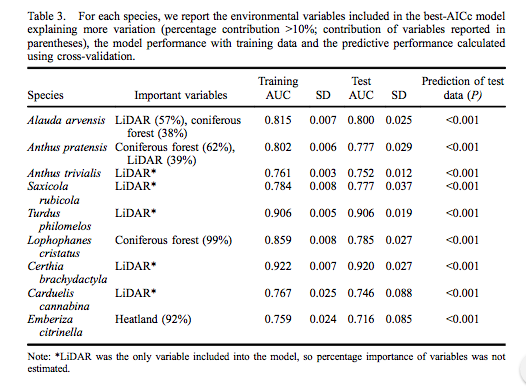
Results indicated that in general there was a lack of collinearity between environmental variables (|r| < 0.7), with the exception of canopy height being positively related to coniferous forests and negative to heathland and a negative relationship between forest and heathland. Seven out of the nine species of birds evaluated using MaxENT were found to be best predicted using LiDAR provided information with the majority of models performing best with LiDAR only information. This finding suggest that increased detail in provided environmental information (eg: LiDAR) will provide, in general, better fit models for predicting species distributions. Provided the measured environmental information is relevant to predicting the occurrence of the focal species.

