The effect of sample size and species characteristics on performance of different species distribution modeling methods

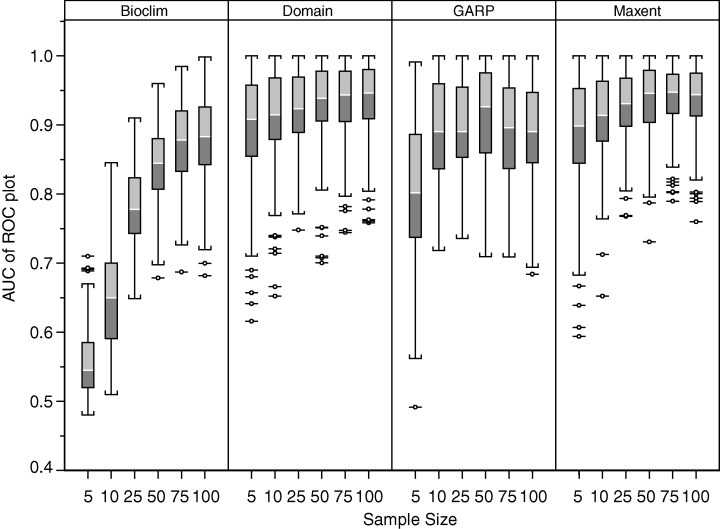
Species, especially those of interest to conservationists, often have limited to rare occurrence data. This “sparseness” of the occurrence data poses problems with developing accurate distribution models/predictions. Previous studies have examined the effect of sample size on the accuracy of these SDMs; however, the sample size of individual species has not been investigated. Individual species characteristics, such as range size, may impact the accuracy of the models. The authors examine the impact of sample size on model accuracy for 18 taxa (California taxa) using 4 modeling methods using presence only data.

Of the methods used, MaxEnt provided the most useful results even as small sample sizes (5, 10, 25, of the maximum 150).  The Domain and GARP performed reasonably well with the small sample sizes. However, Bioclim performed with worst. They also point out that multiple measures of model accuracy, not just AUC, are needed to determine the performance. In terms of species characteristics on model performance, species with smaller ranges, both geographical and environmental, provided greater accuracy in the models.  The authors then highlight that these models should be used by conservationists to estimate rare species distributions.

Hernández, P. A., Graham, C. H., Master, L. L. & Albert, D. L. 2006 The effect of sample size and species characteristics on performance of different species distribution modeling methods. Ecography (Cop.). 29, 773–785. (doi:DOI 10.1111/j.0906-7590.2006.04700.x)

Maximum Entropy-Based Ecological Niche Model and Bio-Climatic Determinants of Lone Star Tick (Amblyomma americanum) Niche

Amblyomma americanum, Lone Star tick, is capable of transmitting several human and zoonotic pathogens.  The species is currently (as of the paper, 2016) has a known distribution of the Southern and Eastern United States, with some eastern parts of Kansas within the range.  However, there is increasing evidence that the species is also located in western areas of Kansas and diseases caused by the transmittable pathogens also occurring.   The authors intend to update the predicted distribution of the species across the Kansas landscape using MaxEnt.

Amblyomma_americanum_tickFemale adult lone star tick (Amblyomma americanum)
Known occurrence data of the species was obtained from three sources providing historical and current surveys.  Environmental data was gathered from CliMond.  This set provides more data, such as soil moisture, that is more biologically relevant to the tick species.  To remove autocorrelation between predictor variables, the Band Collection Statistics tool (ArcGIS) was used to exclude pairs of highly correlated variables.  Lastly, PCA was used on the predictor CliMond variables and standardized components of a reduced dimensionality were used in the MaxEnt model.

From the results of the PCA, ~88% of the variation in the was explained by the first two principle components.  The first consisted mainly of soil moisture and temperature variables (61.4%) and the second consisting mostly of precipitation (26.4%).  The MaxEnt model resulted in a best fit AUC of 0.84.  The easternmost regions of Kansas provided the highest suitability of the species with a decrease going westward (Featured Image).  However, there are some regions in the west that are suitable for the species.  These results are of a wider range that currently(previously) predicted.  The authors then go into discussion how the climatic variables included in the model may affect the behavior/ecology of the ticks particularly interspecies interactions and questing behaviors. With this increase in potential range, the risk for pathogen transmission also becomes worrisome.  The authors close by commenting on the potential impact that climate change can have on the distribution/potential distribution of the species.

Raghavan, R. K., Goodin, D. G., Hanzlicek, G. A., Zolnerowich, G., Dryden, M. W., Anderson, G. A. & Ganta, R. R. 2016 Maximum Entropy-Based Ecological Niche Model and Bio-Climatic Determinants of Lone Star Tick (Amblyomma americanum) Niche. Vector-Borne Zoonotic Dis. 16, 205–211.

A synthesis of transplant experiments and ecological niche models suggests that range limits are often niche limits

“Elephants can’t cross oceans.”

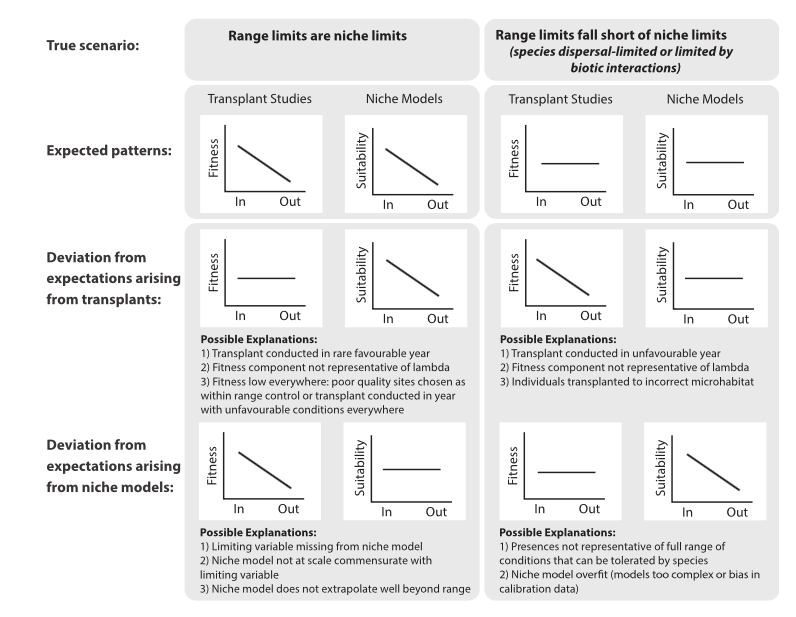
The focus of the paper is determining if dispersal limitations constrain the  range limits of a species rather than the abiotic and biotic conditions of an area.  This allows for a better understanding of the drivers of species distributions and traits that limit the range expansion. Transplant experiments and Ecological Niche models are used to examine if the range limits are also the niche limits of a species. If both of these approaches are appropriately designed, they should give very similar results to if the range limits are the same as the niche limits.  It is expected that both the studies and models would have a decline in fitness and suitability measures across the range limits (Featured Image).  However, if the species range is dispersal limited, there is no change in these two measures across the limits.  In the study, the authors surveyed the results of transplant studies of 40 species and built the ENM for each species (using MaxEnt).  To compare the results of each and determine if there is a decline in fitness and suitability across range limits, they generated linear mixed-effects models (independently).

For most species, a decline in fitness and suitability from sites inside the range to outside the range. However, overall there is a decline in both measures from sites inside to outside the limit. The authors highlight that these results support that the range limits of a species is also often the niche limit. Further, the dispersal of a species does not the range limit. Also, the authors point out that better designs of transplant experiments and ENM along with the combination of the two methods would lead to a better understanding if the range limit of a species is also the niche limit of the species.

The authors close by pointing out that outside influences (such as human interactions and dispersal limits) may cause the range limit to a subset of the niche limit.

Lee-Yaw, J. A., Kharouba, H. M., Bontrager, M., Mahony, C., Csergő, A. M., Noreen, A. M. E., Li, Q., Schuster, R. & Angert, A. L. 2016 A synthesis of transplant experiments and ecological niche models suggests that range limits are often niche limits. Ecol. Lett. (doi:10.1111/ele.12604)

In defense of ‘niche modeling’; ‘Niche’ or ‘distribution’ modeling? A response to Warren

These papers discuss and argue the terminology used to describe the process of determine where species are able to inhabit.  Specifically the use of the terms Ecological Niche Models and Species Distribution Models to describe the techniques used to determine where or potentially where species are able to inhabit.

Warren (2012) criticizes the “loss” of the niche in the terminology.  While he sympathizes that many of these models are trained using data that only comes from the distribution of a species, he also argues that the underlying assumption of these models is that they are estimating the niche. The argument that these environmental predictors have some effect on biological processes of the organism and that often these models omit processes (e.g. dispersal).  Here, he defines the niche as the “conditions within which the species can survive and reproduce”. He suggests we continue to acknowledge the conceptual framework being used and the we are attempting to estimate the niche in our research.

In a response to Warren, McInerny and Ettienne (2013) defend the position of using ‘distribution’ to describe the techniques.  They criticize his definition (even the definitions he provides, pointing out that he invokes two ones)  of niche saying it constrains the selection of predictor variables to ones that are only biological.  However, they point out that these problems have also been considered with the SDMs through parameter selection, model structure, and functional forms.  Lastly, the point out that other words could also be used to describe these models (“habitat suitability”, “bioclimate envelopes”, “resource selection”) but they stand by the choice of the neutral words “species distribution modeling”.

Warren, D. L. 2012 In defense of ‘niche modeling’. Trends Ecol. Evol. 27, 497–500. doi:10.1016/j.tree.2012.03.010

McInerny, G. J. & Etienne, R. S. 2013 ‘Niche’ or ‘distribution’modelling? A response to Warren. Trends Ecol. Evol. 28, 191–192. http://dx.doi.org/10.1016/j.tree.2013.01.007

Five (or so) Challenges for Species Distribution Modeling

The authors present 5 challenges for SDM.   By confronting these models, we should be able to generate better and provide a better understanding of  these models.

  1. Clarification of the niche concept: The authors suggest a diversion from the Hutchinson definition of the niche (n-dimensional hyper-volume of environmental variables) to more of a Grinnellian definition: the set of environmental conditions at which the birth rate of the population is greater than or equal to the death rate.  They also point out the need for the clear(er) distinction between potential habitats for species (ranges/areas that the conditions are “right” for a species to inhabit) and potential geographic distributions of species (incorporates spatial factors such as dispersal)
  2. Improved designs for sampling data for building models: Models are sensitive to bias. Subsampling datasets are likely to remove or reduce biases. A (more expensive) alternative is to target specific, strategic additional sampling locations.
  3. Improved parameterization strategies: Different parameterizations of models can result in vastly different projections of species distributions.  We to better understand why and when different parameterizations of the same technique provide different results.
  4. Improved model selection and predictor contribution: There are many different strategies that can be used to compare different models. However, finding the individual contribution of each predictor is a more difficult problem.  Further testing of proposed solutions provided by the authors is needed.
  5. Improved model evaluation strategies: Evaluation of models can be discussed in the light of three different implementations: explanation, understanding and prediction. Typically modelers use the “wrong” evaluation tool outside of the scope of their goal or question. They present two different forms of evolution: verification (projecting using an new/independent set of data) and validation (maximizing the fit to training data).

Araújo, M. B. & Guisan, A. 2006 Five (or so) challenges for species distribution modelling. J. Biogeogr. 33, 1677–1688. (doi:10.1111/j.1365-2699.2006.01584.x)