Bias correction in species distribution models: pooling survey and collection data for multiple species

Fithian, W., Elith, J., Hastie, T., Keith, D. A. (2015), Bias correction in species distribution models: pooling survey and collection data for multiple species. Methods in Ecology and Evolution, 6: 424–438. doi: 10.1111/2041-210X.12242


Presence only records are common for rare species, but are often biased due to a haphazard collection schemes. The authors propose a correction for this bias by using presence – absence data with similar geographic sampling biases from other species.

Most popular presence only models are motivated by an inhomogeneous Poisson process (IPP). The IPP for a single species presence only data can be extended to adjust for sampling bias by incorporating presence – absence data from multiple species into a single joint probabilistic model to estimate and adjust for bias. The authors evaluate their model using both presence – only an presence – absence data for a set of Eucalypt species from south–eastern Australia (R package multi–speciesPP). Presence – only point processes can be thought of as a thinned presence – absence point process. How and where the thinning occurs is biased by opportunistic presence only sampling. See figure 1 for visual explanation. This means, at best, presence only IPP estimate relative intensities not probabilities of occurrence. This is due to the identifiability issue of parameters in the thinned intensity function.
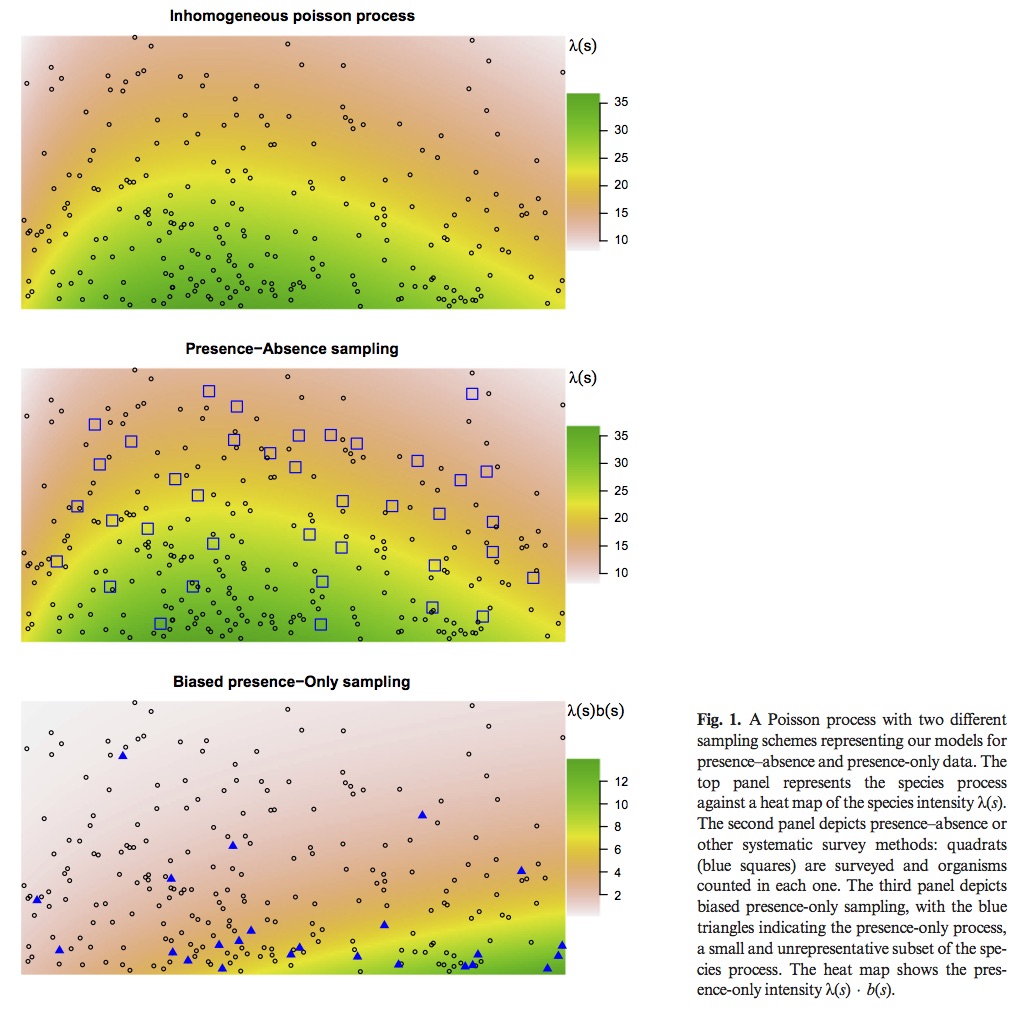
wk10_Fig1

Previous attempts to correct for this bias have included factors that lead to sampling bias such as distance from roads and population centers. However, these corrections only work if they do not correlate with environmental variables. In Australia large populations are clustered along the East Coast, but important climatic variables are also correlated with distance from the same coast.

The authors propose using a joint log linear IPP model for multi-species data, a subset of which are presence – absence data. The point process and send point process are both assumed to be independent across species with a log linear intensity and bias, however bias intercept (delta) is not allowed to vary across species. This restriction assumes that bias is proportional across species which allows the authors to pool the information into a single estimate – deriving the bias of presence only data from presence absence data.

Testing the method:

The Eucalypt data set consists of 36 species at 32,612 sites with an average of 547 presences per species. However, this range is variable 4 species have fewer than 20 observations and 8 having more than 1000. The presence only data consists of 764 observations supplemented with 40,000 background points. The authors evaluated their methods by assessing the assumption of proportional sampling bias, and the impact of pooling multiple species on predictions.

The proportional bias assumption was found to be appropriate in some species, and inappropriate in others. Pooled data had the greatest impact on model performance when the presence absence data for species of particular interest were either scarce or nonexistent. The authors  acknowledge the proposed method has many shortcomings, but point out that it performs better than models with no sampling bias correction.

Modelling ecological niches from low numbers of occurrences: assessment of the conservation status of poorly known viverrids (Mammalia, Carnivora) across two continents

Papeş, M. and Gaubert, P. (2007), Modelling ecological niches from low numbers of occurrences: assessment of the conservation status of poorly known viverrids (Mammalia, Carnivora) across two continents. Diversity and Distributions, 13: 890–902. doi:10.1111/j.1472-4642.2007.00392.x


In order for a species to occupy their ecological niche that abiotic and biotic conditions need to be favorable in addition to being geographically accessible. These niches are most often modeled with the most common data – present records, but this data has plenty of issues including unknown sampling holes, linking time of collection with abiotic factors, biased geographical sampling, and geo-referencing museum specimens. Poorly studied species have the additional challenge of low sample size, which exacerbates the previous issues and may also biased sampling of environmental space. Previous studies have shown ENM with small sample sizes performance are dependent on model and variable choice, machine learning does better. The authors use this discrepancy and model performance to motivate the comparison of GARP to the (at the time) newer modeling approach of MaxEnt.

Models were compared for 12 species. The current state of was collected from museums specimens, which were geo-referenced. All 19 Bioclim variables were used at the 4.5 km resolution. The default values were used for MaxEnt and along with linear features. In the case of N>10 quadratic features were also used. GARP, a machine learning methods, used 50% of the data to produce 200 to 500 models. The remaining 50% of the data was used to test model performance; the 10 models with the lowest false-negative rate were kept. Outputs of each modeling approach were compared using zonal statistics. The ecological niche models were combined with land-use and current reservation/conservation status.

MaxEnt and GARP models had general positive association – but not a strong trend (Figure 1). In other words, they had similar distributions but very different means. MaxEnt predictions’ were broader than GARP, the reverse of expected (Figure 2 and 3).

Scale-dependent role of demography and dispersal on the distribution of populations in heterogeneous landscapes


Motivation: Both dispersal and local demographic processes shape the distribution of the population among varying habitat qualities. However most theories, experiments, and field studies have focused on dispersal.  The authors attempt to show how both dispersal and demographic processes shape a population’s distribution, and when either mechanism is more important.

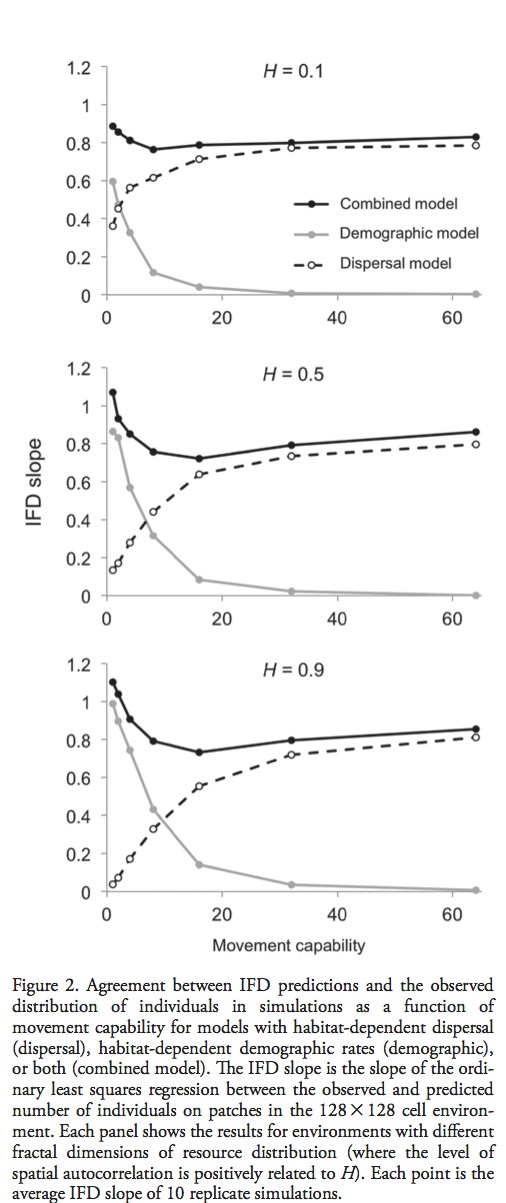
Population dynamics were primarily explained via demographic processes, while distribution was a function of dispersal process. These authors would also like to bring in the ideal free distribution (IDF) theory to explain population distributions.  IDF  predicts that individuals will be distributed among patches of different quality so that the fitness of individuals in different patches is equalized – individuals can’t improve fitness by moving to another patch. As an aside, given that the underlying theory requires individual choice of patch occupancy this work is only appropriate for populations that can actively choose how they are dispersed or move.  The IDF can arise from 2 possible mechanisms: 1) dispersal, where individuals use information about habitat quality to make movement decisions, or 2)  demographic processes where the habitat quality experienced by individuals affects demographic rates.

Methods:  The authors explore the 2 mechanisms that lead to IDF by extending a individual-based model of habitat dependent dispersal, growth, reproduction, and survival of individuals. All simulations wer done on a 128 x 128 cell grid. Each  grid/habitat patch had its own logistically growing resource, and patch quality differed by the carrying capacity of this resource. To examine the relative effects of dispersal and demography, the model simulations were run with only habitat dependent dispersal, habitat dependent demography, or both.   This was done by varying 2 traits: the maximum dispersal distance (M) and the spatial scale of resource heterogeneity (H).

Wk4Fig 2


Results: When both habitat dependent dispersal and demography were included in the simulation population distributions closely matched IFD predictions.   Simulations of populations with only demographic processes (i.e. Dispersal only) were overabundant in low-quality patches and under abundant in high-quality patches resulting in low correlation with IFD predictions. This effect was exacerbated in environments where the spatial scale of resource heterogeneity was large. When habitat quality influenced demographic rates (but dispersal was random), the effect of scale on IFD  was reversed – highly mobile populations were sub optimally distributed with respect to habitat quality, reducing the scale of resource heterogeneity only exacerbated the trend.

Take-home: Pulliam demonstrated the need to include passive dispersal processes when describing population distributions, Martin et al.  has demonstrated the need to include dispersal and demographic processes of populations with active dispersal. Spatial scales that limited the resource matching capacity of one process coincide with those that promoted the resource matching capacity of the other process.


Martin, Benjamin T., et al. “Scale‐dependent role of demography and dispersal on the distribution of populations in heterogeneous landscapes.”Oikos (2015).  doi: 10.1111/oik.02345

The vulnerability of species to range expansions by predators can be predicted using historical species associations and body size

The vulnerability of species to range expansion by predators can be predicted using historical species associations and body size. Declines in abundance in local extinctions are the direct consequence of climate exceeding physiological tolerances in addition to the indirect consequences of climate change on species interaction. These indirect impacts of climate change and biodiversity are more difficult to predict or observed when compared to the physiological impacts.

Species ranges have changed at variable rates under climate change, potentially making novel ecosystems. However, species expanding their range can encounter resident prey, predators and competitors that were present in their historical range (i.e. species historically occurred in some patches). The ecological niche concept has been used to understand patterns of co-occurrence and species interaction; this could also be a useful tool to protect the indirect impacts of climate change.

Here, the authors suggest using species associations and body size as a simple measure of the impacts of species introductions facilitated by climate change. Negative associations can indicate strong ecological interactions including competitive exclusion, predation or it could indicate different abiotic requirements. Functional traits often mediate the strength of species interactions – which can be used to infer niche differences. Body size is correlated with many functional traits (i.e. reproductive rate, dispersal ability, diet breadth and or predation). Increased differences in body sizes would indicate decreased competition, while the ratio of predator to prey body size indicates strength of predation.

The authors hypothesize that pairwise species associations and body size can predict the relative risk imposed on resident species by predators whose ranges are expanding. They focus centrarchid predators undergoing range expansion in the Great Lakes region. This expansion is expected to be problematic since these predators are not often found in smaller lakes with the potential prey species. The question then becomes whether this negative species associations are good predictors of vulnerability, and how resident species body size impacts the risk associated with additional predators.

Methods: The data set consisted of 1551 links with paired historical and contemporary species samplings. A total of 106 fish species were observed which was then used to create presence absence data pairs in 2 x 2 contingency tables. The Phi– coefficient was calculated for these 2 x 2 tables (range from -1, 1) the relative risk ratio was then calculated on the tally of lakes where the resident species was absence after the introduction of the predator.

Results:  Centrarchid introductions significantly increase the likelihood of some prey species loss, while protecting loss of native centrarchids based on introduction data. Historical species associations were a strong predictor of the introduced species’ impact. Additionally, resident species total length was a significant indicator of the relative risk ratio.

Take home:  Traits mediate species interactions, and body size is an easily measurable trait that is correlated to many other traits in fish species. Body length and historical species associations can be used to forecast the impact of introduced species on the native species under climate change.

Given that fish can have convoluted food webs, using body size as a proxy of competition and predation seems like a very elegant solution.


Alofs, Karen M., and Donald A. Jackson. “The vulnerability of species to range expansions by predators can be predicted using historical species associations and body size.” Proc. R. Soc. B. Vol. 282. No. 1812. The Royal Society, 2015. http://dx.doi.org/10.1098/rspb.2015.1211


Anonymous nuclear markers reveal taxonomic incongruence and long-term disjunction in a cactus species complex with continental-island distribution in South America

Motivation:The Pilosocereus aurisetus complex is comprised of 8 cactus species associated with the rocky savannas in eastern Brazil. Species have been defined by morphological and genetic traits. However, different genetic markers lead to different conclusions. For these reasons the authors attempt to answer the following questions regarding the complex diversification:

(1) Are the northern P. aurisetus populations more related to the other conspecific populations in the Espinhaço Mountain range or to population from other species in Central Brazil, as shown by cpDNA data?

(2) Is the currently recognized P. machrisii species composed of two distinct lineages?

(3) What is the relationship of P. jauruensis with the other species of the complex?

Additionally,  the authors also tested climatic niche differences between the observed geographic lineages with the hopes of making some inference of the complex’s phylogeographical history.

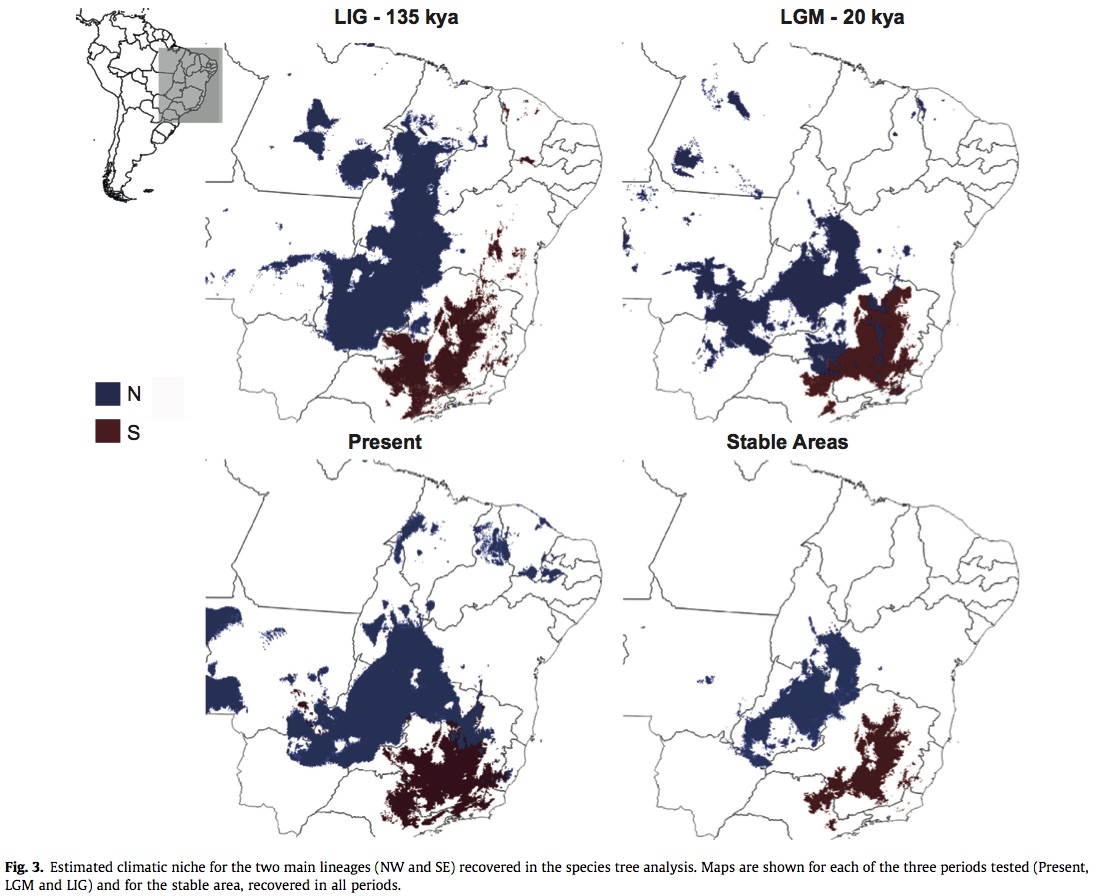
MethodsAmplicons from AFLP of 40 Pilosocereus samples consisting of 4 species from P. aurisetus species group and and out group. These species have the widest distribution and were the most phylogenetically unresolved. Sequences were processed to identify loci and then alleles across the species and populations.  The alleles were used to infer the most likely number of interbreeding groups in the data set without any sampling site information.  The most likely number of interbreeding groups were then treated as operational taxonomic units (OTUs) and used to estimate a species phylogenic tree.  Species occurrence data was obtained by GPS measurements during transacts of the range in addition to occurrences in the global biodiversity information facility. Sample sizes were generally small for each species and therefore not prone to over fitting. Climatic divergence in addition to genetic divergence was tested by grouping the occurrences according to the genetic lineages recovered by phylogenic analysis. The effects of past climatic oscillations on the niche of each lineage were determined by fitting the models in the present, 21 kya (LGM), and 135 kya (LIG) scenarios using 3 different algorithms. Of the 19 BIOCLIM variables, the authors used 6 which were which were showed to have low correlation and high informativeness. The model outputs were converted into presence/absence data based on a threshold value where the ratio of true positives to actual positives and true negatives to actual negatives is equal. In a area with at least 3 overlapping projections was considered suitable – climactic stable areas were suitable in all 3 time periods.

Results and Discussion: The genetic analysis inferred 5 mating groups split between two main geographic lineages. The two lineages had minimal overlap in all time periods, this overlap was even smaller far stable areas (overlap in all three times). The climatic niche does not appear to have changed over time indicating that range shifts were not crucial for present day distributions. 

Perezetal_Image

Thoughts: The genetic analysis was very thorough and well developed. However, the niche mapping wasn’t fully integrated into the rest of the study.  I think this is a good example of the consequences of developing easy to use data (WorldClim). It is not really clear how the determining the climatic niche over time strengthen the authors’ phylogenetic conclusions.


Manolo F. Perez, Bryan C. Carstens, Gustavo L. Rodrigues, Evandro M. Moraes. Anonymous nuclear markers reveal taxonomic incongruence and long-term disjunction in a cactus species complex with continental-island distribution in South America. Molecular Phylogenetics and Evolution. Volume 95, February 2016, Pages 11–19 doi:10.1016/j.ympev.2015.11.005