Plants’ native distributions do not reflect climatic tolerance

Bocsi, Tierney, et al. “Plants’ native distributions do not reflect climatic tolerance.” Diversity and Distributions (2016).

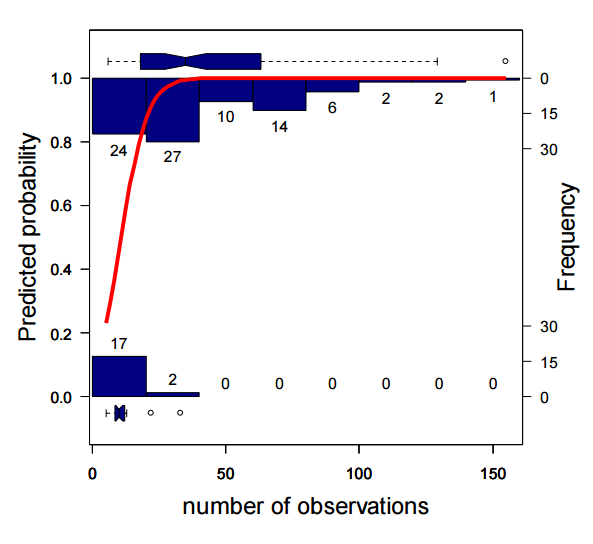
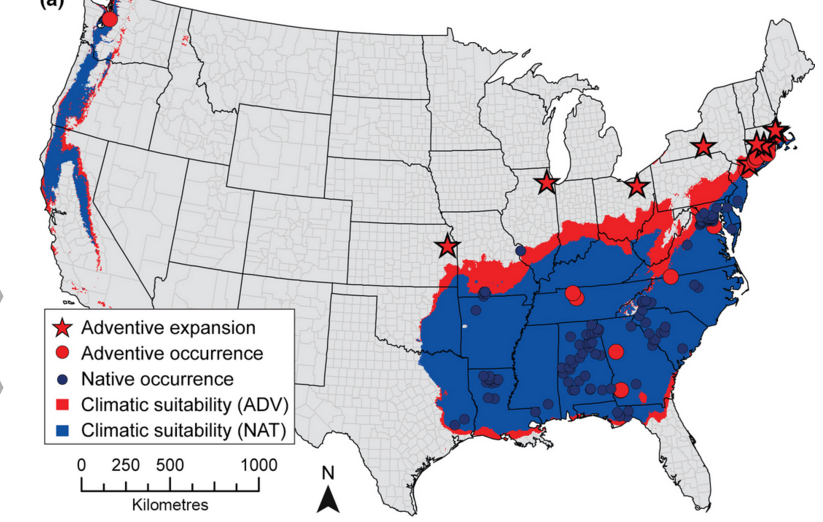
This paper is related to the last one I posted on in that it argues that a core assumption of species distribution models is violated, and that this violation could influence the applicability of species distribution models. The often-violated assumption is that of range equilibrium, and the full exploitation of environments which the species can persist. That is, the assumption that species occurrences in space capture niche boundaries. To address how often species can persist outside of their predicted niche boundaries, the authors used data on 144 US plants that occurred in their native range, and that were introduced through ornamental use (“adventive”).  They Googled plant names + “garden” or “for sale” to determine if the plant was ornamental. They pulled county-level data from multiple sources, including GBIF, and a bunch of herbaria, arguing that herbarium collections identify the native range, and the Biota of North America Program (BONAP) to get at adventive occurrences outside of the native range. The authors trained MaxEnt models on each species in both native and native+adventive ranges on 3 variables (annual precipitation, minimum January temperature and maximum July temperature). The data needed to consist of at least 10 native occurrence points, and at least 1 adventive point. The authors found that the inclusion of adventive occurrences expanded the predicted suitable geographic range for 86% of the species examined. There was a negative relationship between the size of the native range and the amount of niche expansion. Model accuracy was high on average (> 0.9 ), and was consistently higher for models trained on only the native occurrence points. The authors claim that the increase in the size of the geographic range as a function of including adventive occurrences is evidence that the assumption that occurrence points represent the realized niche is overly optimistic.

No‐analog climates and shifting realized niches during the late quaternary:

Veloz, Samuel D., et al. “No‐analog climates and shifting realized niches during the late quaternary: implications for 21st‐century predictions by species distribution models.” Global Change Biology 18.5 (2012): 1698-1713.

Species distribution models are often used to predict species range shifts as a function of climate change. However, the authors argue that some of the core assumptions of species distribution models are violated when attempts are made to project species distributions into some climate change scenarios in which there are no-analog environments (i.e., those present in the future but not present now). This is because the models do not model the fundamental niche, but instead the realized niche given the data. Dispersal limitation or the absence of an environment at the margin of a species niche could cause this niche underfilling that would bias SDM predictions. To address this, the authors examine the performance of five species distribution models (SDMs) and two ensemble models trained on fossil pollen data from North America. Further, the authors measure niche overlap as a function of time (1, 8, 15 ka BP) for the set of 20 taxa considered, providing evidence for significant climatic niche shifts in 70% of species. The authors place many of the SDM accuracy results in the supplement, and focus on the estimated niche shift aspect. What I find most strange is that authors discuss the niche in such detail in the introduction, and argue that species distribution models may not capture the niche for a list of reasons, setting up themselves to address if/when SDMs can predict the niche when climate changes. However, the authors choose to model relative abundance of pollen as the data given to the niche models, instead of occurrence data. This strikes me as strange for two reasons. First, pollen could be in an area where the plant is unlikely to grow, or may not even be viable, and therefore doesn’t really represent the plant niche at all. Second, species distribution models typically use binary data (presence-absence) to estimate the niche. The ability to predict relative abundance is 1) dependent on other species present (other species aren’t considered in the traditional niche concept), and 2) not really the aim of species distribution models generally. Perhaps I’m just being obtuse though.

Estimating patterns of reptile biodiversity in remote regions

Ficetola, Gentile Francesco, et al. “Estimating patterns of reptile biodiversity in remote regions.” Journal of Biogeography 40.6 (2013): 1202-1211.


The authors aim to predict species richness of reptiles (turtles, amphisbaenians, and lizards) in the Western Palaearctic using Bayesian autoregressive models (BCA) and spatial eigenvector mapping. They used these methods to account for the significant amount of spatial autocorrelation in their predictor variables. They considered accesssibility (travel time to nearest city with population > 50000 people), density of protected areas, and environmental covariates as their predictors of species richness, where richness was count data with an assumed Poisson error distribution. They argued that accessibility was a layer that got at sampling and collection biases. Further, they argued that spatial resolution could influence predictions, so they predict at 1 degree squared and 2 degree squared resolution. Further, they transformed nearly all of the predictor variables, which I can’t really tell if they needed to based on the modeling approach. Models were validated by comparing predicted species richness to data from exhaustive sampling on a subset of the spatial cells. Accuracy was computed by comparing outputs of 3 linear models of predicted versus actual richness values (1. actual ~ predicted, 2. actual ~ recorded richness until 2008, 3. actual ~ intercept). BCA models were qualitative similar to the spatial eigenvector approach, and the BCA models predicted species richness with high accuracy.

A comparison of Maxlike and Maxent for modelling species distributions

Merow, C., Silander, J. A. (2014), A comparison of Maxlike and Maxent for modelling species distributions. Methods in Ecology and Evolution, 5: 215–225. doi: 10.1111/2041-210X.12152

Here, the authors compare MaxLike (presence only method set up by Royle et al. 2012) to MaxEnt (widely used presence-background method). They detail how MaxEnt and MaxLike compare in their structure, providing instances of when predictions between the two would differ, and then linking the two through a discussion of sampling assumptions. The authors advocate for the use of MaxEnt’s raw output (relative occurrence rate), and point out reasons that the raw output is not equivalent to an occurrence probability (e.g., λ(x) may be larger than 1).

The authors further show the sensitivity of MaxLike to smaller sample sizes (Figure 3), using both empirical (Carolina wren data), and simulated data (using same model as Royle et al. 2012). MaxLike and MaxEnt outputs were strikingly similar (correlation of 0.999) when considering the raw output (relative occurrence rate) as the unit being compared between approaches. In some circumstances (low sample size), it may be difficult for Maxlike to estimate the intercept (β0) value.

In the end, the authors offer a defense of MaxEnt, and argue that both MaxLike and MaxEnt may make strong assumptions. For instance, MaxEnt assumes that the data are a random sample of individuals (though don’t both methods make this assumption?), and makes the assumption that the loglinear model is appropriate for the count data (which is defensible). Basically, if sample size is large and detection probability is constant, Maxlike is preferred since it can directly estimate occurrence probability. If sample size is small, and the model is more focused on habitat suitability instead of actual occurrence probability, the raw output (relative occurrence rate) of MaxEnt may be preferred.


Do Ecological Niche Models Accurately Identify Climatic Determinants of Species Ranges?

Christopher A. Searcy and H. Bradley Shaffer 2016. Do Ecological Niche Models Accurately Identify Climatic Determinants of Species Ranges? The American Naturalist 187 (4)

http://www.journals.uchicago.edu/doi/full/10.1086/685387

The authors examine the agreement between MaxEnt models of the California tiger salamander and known drivers of juvenile tiger salamander recruitment obtained through long term field surveys and demographic data. Climatic variable importance on juvenile recruitment was determined using an ANCOVA, where the response was the number of metamorphs, pond identity was the categorical variable, and each BioClim variable was a continuous covariate. They used model selection to determine which BioClim variables were the most important. They fit two MaxEnt models, one with randomly sampled background points and the other using a sampling bias mask to sample sites where amphibians were collected more often. MaxEnt variable importance isn’t directly comparable to their ANCOVA results, since MaxEnt will consider non-linear relationships during feature creation. They addressed this by taking the BioClim variables that were significant in the ANCOVA, and determining the linear relationship in the MaxEnt nonmarginal response curves for each BioClim covariate. If the correlation between climatic variable and either habitat suitability (MaxEnt output) or number of metamorphs (ANCOVA response variable) was of the same sign, the authors argued that it was a sign of agreement between MaxEnt models and the demographic data. They found that MaxEnt was able to find those variables most important to juvenile salamander recruitment, providing support for the use of niche models to capture aspects of species biology. They also examined some habitat suitability shifts as a function of climate projections, but I’m not going to go into that. The coolest part was their approach to quantify what they know about the population biology of the salamander species, and directly relating that to the important covariates from a niche model.

Spatially explicit predictions of blood parasites in a widely distributed African rainforest bird

Sehgal, R. N. M., et al. “Spatially explicit predictions of blood parasites in a widely distributed African rainforest bird.” Proceedings of the Royal Society of London B: Biological Sciences 278.1708 (2011): 1025-1033.


Predicting the potential spatial distribution of parasite species has both obvious rewards (e.g., mitigating human disease) and inherent difficulties. One of these difficulties is that the distribution of parasites is commonly determined by two different, but interacting, filters. Parasite species are obligate at some stage, meaning their distributions are constrained by host distributions. Further, they are still subject to the external environment. Here, the authors use infected host records as point occurrences to train Maximum Entropy models. Specifically, occurrence records consisted of olive sunbird hosts infected by one of two avian parasites (_plasmodium_ or _trypanosoma_). These parasites exist on other hosts, and the host likely exists outside of the area examined (West Africa). Using these occurrence records, they created geographic maps of occurrence probability of infected birds (as that is what their occurrence records are). They determined environmental variable importance (Figure 1 in the paper) for both parasites, and then combined results from a random forest analysis to predict pathogen prevalence across space. This was done by training random forests on prevalence data using environmental covariates, and then projecting the reuslts onto unsampled regions in space, constrained by the MaxEnt occurrence probability predictions. Neat idea, neat paper, lots of questions raised about their approach. There are many assumptions built-in using infected hosts as occurrence points, and even more in projecting prevalence-environment relationships onto point predictions from MaxEnt (i.e., doesn’t this assume transmission is not a function of host density, population genetics, interacting community of hosts/non-hosts, etc., but is instead only a function of environment?).

Generating realistic assemblages with a joint species distribution model

Harris, D. J. (2015), Generating realistic assemblages with a joint species distribution model. Methods in Ecology and Evolution, 6: 465–473. doi: 10.1111/2041-210X.12332


The last article I reported on examined stacked species distribution models (SDMs) to predict species richness across a landscape. This paper extends the idea of using SDMs for studies at the community level, incorporating information ignored by stacked SDMs (i.e., data on species co-occurrences). One method that incorporates data on species co-occurrences is joint species distribution modeling (JSDM). Here, the author extends this approach using a stochastic neural network approach (which he refers to as mistnet). This approach is compared to two common approaches. First, a stacked SDM of trained boosted regression models for each species. Second, a deterministic neural network approach. All approaches used breeding bird survey data. These data were split into train and test sets, where test data consisted of 280 routes and the training set of 1559 routes, separated by a 150 km buffer (see Figure 2 from paper). The deterministic neural net performed comparably to mistnet in predicting species occurrence probabilities, but mistnet outperformed the deterministic neural net when predicting community composition at a given site. The traditional joint SDM did not perform well in either task. The article doesn’t go into the tuning of mistnet (e.g., number of hidden layers), but it looks really cool, and all the code is available on Github.

A probabilistic approach to niche-based community models for spatial forecasts of assemblage properties and their uncertainties

Pellissier, Loïc, et al. “A probabilistic approach to niche‐based community models for spatial forecasts of assemblage properties and their uncertainties.” Journal of Biogeography 40.10 (2013): 1939-1946.


Species distribution models (SDMs) are typically developed for a single species, because most of the time the goal is to predict habitat suitability for the occurrence of a single species. However, could there be more information about latent environmental traits, or about the probability of species occurrence in data on the presences of other species? Probably. These authors investigated an approach to predict uncertainty in predictions of community properties from stacked species distribution models. Stacked species distribution models are simply a set of independently trained species distribution models that are then laid on top of one another to predict community composition or species richness across a landscape. They don’t incorporate co-occurrence data directly, which is a flaw in my opinion, and this is recognized and has been tackled in other papers. To assess the ability of stacked SDMs to predict species richness, the authors compared a hard threshold approach (each binary SDM was converted into presence-absence predictions, the sum of the predicted presences formed the species richness in a given cell), and a probabilistic approach (each SDM predicted a probability, and these probabilities were compared relative to a 10,000 draws from a binomial distribution). The latter approach resulted in a stronger correlation between expected and observed species richness values. Further, the authors argue that this approach gets at uncertainty in model predictions, by using the variability from the 10,000 draws to get at uncertainty. This demonstrates the utility in considering community context in species distribution modeling. Methods directly incorporating information on co-occurring species will likely provide an even better view of the realized niche of species, or of community composition across a landscape.

Grassland species loss resulting from reduced niche dimension

Harpole, W. Stanley, and David Tilman. “Grassland species loss resulting from reduced niche dimension.” Nature 446.7137 (2007): 791-793.


This study aimed to test a hypothesis derived from niche theory called the ‘niche dimension hypothesis’. This hypothesis posits that the addition of co-limiting resources should reduce species diversity while also increasing productivity. To test this, the authors used data on a previous enrichment study, combined with a similar experiment to get at the role of co-limiting nutrients on plant community dynamics in a grassland community. They varied the number of limiting resources they added (nitrogen, phosphorous, calcium, and water) in all possible pairs, finding that no one resource was strongly limiting, but many resources were co-limiting. They found the number of resources added was negatively and non-linearly related to the number of species in the community, but positively related to above-ground biomass. This suggests that a small subset of species are able to dominate in high resource environments, and is some of the motivating work behind the biodiversity-productivity navel-gazing fest that is currently taking place among ecosystem ecologists (see these papers).

I read this paper because I thought it was going to specifically discuss plant niches and dimensionality reduction. They use dimensionality to discuss the combined effects of the limiting nutrients on species diversity. They further argue for the possibility that competition isn’t the only factor in reducing species diversity, but that plants sensitive to nutrient additions could be exposed to abiotic conditions outside of their niche boundaries. They also discuss the effect of increased leaf litter, which is not a direct competitive interaction (like competition for light).

Modelling ecological niches with support vector machines

JM Drake, C Randin, and A Guisan. 2006. “Modelling ecological niches with support vector machines” J of Applied Ecology. 43, 424-432.

Machine learning approaches get around common obstacles to species distribution modeling (autocorrelated data, presence-only data, etc.), but are relatively recent tools for species distribution modeling. The authors promote and demonstrate the use of Support Vector Machines (SVMs) to model ecological niches, using 106 alpine plant species as a case study.

Benefits of SVM approach

1. Not based on statistical distribution (no independence requirement)
2. SVMs are a one-class approach, simplifying the classification problem (presence-only)
3. Fewer tuning parameters, and deterministic results (model will always converge to same solution given a dataset)
4. Not many observations needed (n=40). Not sure how this compares to other methods though.
5. SVMs are cross-validated
6. SVM and niche both defined as boundary in hyperspace, so using SVM is on firm conceptual ground

The authors test 3 different methods that used dimensionality reduction or variable removal. SVMs performed comparably to MaxEnt, ENFA, and other methods (they didn’t examine all methods on their data, but compared the accuracy they obtained with other published studies on different systems). SVMs without any feature reduction or variable transformations performed the best.