
Due to the recent archiving and georeferencing of plant specimen collected over the past century, the distribution modeling of these species is now easily possible. The authors modeled the distribution of 6,828 species and determined the biological richness of areas in China. In addition, they also investigated the drivers of the richness in the areas.
To prediction the distribution of the species, they used MaxEnt. To analyze regions of species richness, they used ordination and Getis-Ord Gi* statistics finding hotspots of species richness. These also allowed them to determine the drivers of species richness and hotspots.
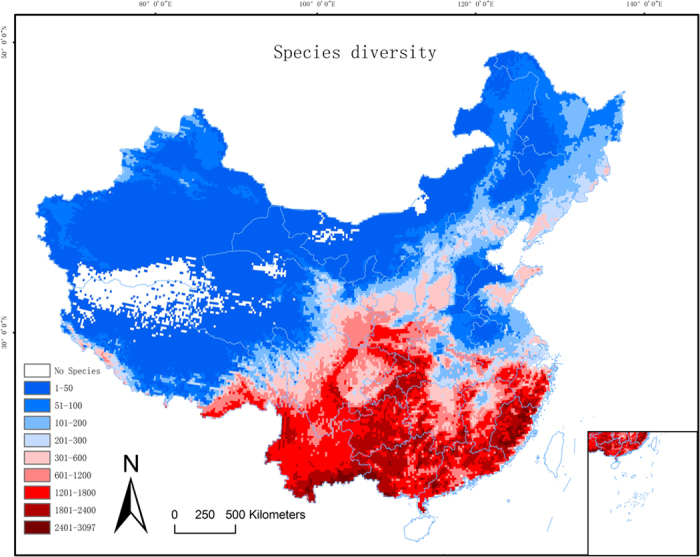
Of the predictors used, annual precipitation and temperature stability provided a major role in the observed species diversity. However, when looking at the different regions, there were different drivers:
- SE – annual precipitation
- SW – topographic & temperature stability
- NW – water deficit
- NE – temperature instability
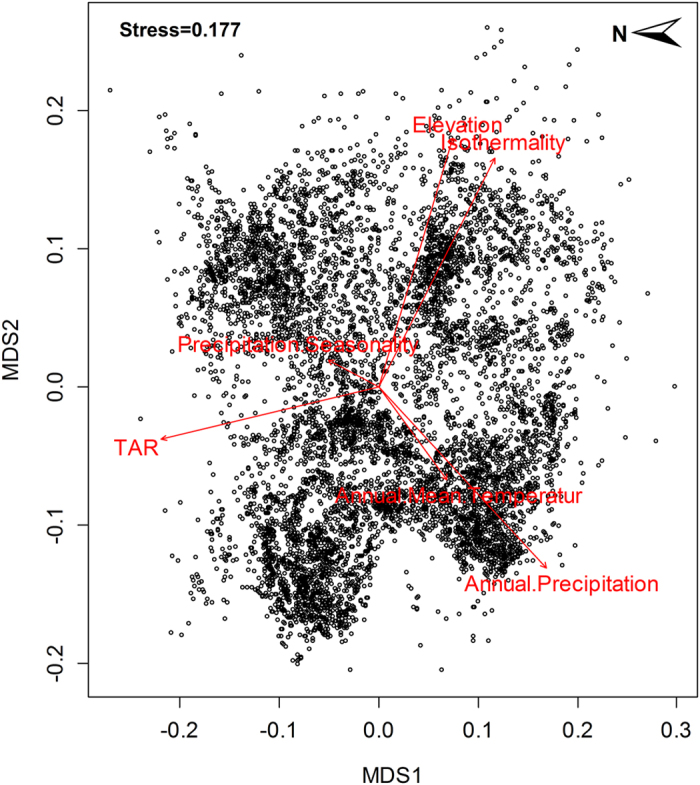
Fifteen uncorrelated variables plotted as predictors of environmental turnover calculated for 6560 woody species. Vectors are displayed only for the highly significant variables (P < 0.001) inferred from non-metric multidimensional scaling (NMDS) ordination. TAR: Temperature Annual Rang.
Zhang, M.-G., Slik, J. W. F. & Ma, K.-P. 2016 Using species distribution modeling to delineate the botanical richness patterns and phytogeographical regions of China. Sci. Rep. 6.