Effects of incorporating spatial autocorrelation into the analysis of species distribution data.

Dormann, Carsten F. “Effects of incorporating spatial autocorrelation into the analysis of species distribution data.” Global ecology and biogeography 16.2 (2007): 129-138.

This review paper investigates the importance of incorporating the effects of of spatial autocorrelation (SAC) into any species distribution model. The author was interested in answering two questions. First, does SAC the parameters estimated from species distribution data? Second, does incorporating SAC increase model performance?

The literature review was conducted using Web of Science, search methods the author believed to be reasonable to handle SAC included the following: autologistic regression, generalized least square regression, and correction of significance levels. The search parameters provided to web of science were: “spatial autocorrelation” and “ecology or distribution”, additionally the author would review any papers not returned through Web of Science, but cited in a paper found through the search criterai. The inclusion criteria were: (1) a species distribution was analyzed (2) presence of a traditional analysis (GLM or GAM) and spatial model (3).

Information extracted from the reviewed studies.

Arrangement of samples

Size of neighborhood

Spatial extent/grain

Type of autoregressive function

Species/group

Quality of SAC removal/control

Response variable

Model coefficients

Statistical methods

Importance of SAC

To measure the effect of correction for SAC the following equation was provided. Where S stands for spatial coefficients and NS stands for non-spatial coefficients.
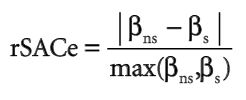
rSACeDoorman2007

The effect of correcting for SAC on overall model quality was quantified with AIC, R2, and deviance-based pseudo-R2.

Findings from this study indicate that there was no difference in response type for single species studies in terms of rSACe. The author did find an effect for the range of spatial autocorrelation (neighborhood) and spatial resolution. Meaning that when controlling for the effect of spatial resolution in the study, the effect of SAC was significant. For the effects of spatial autocorrelation on model quality, the author observed a significant improvement in AIC values when SAC information was provided to the model.
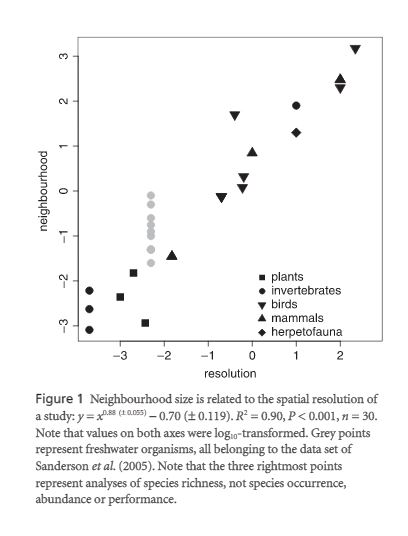
 

Dorman2007

Support vector machines for predicting distribution of Sudden Oak Death in California

Guo, Qinghua, Maggi Kelly, and Catherine H. Graham. “Support vector machines for predicting distribution of Sudden Oak Death in California.”Ecological Modelling 182.1 (2005): 75-90.

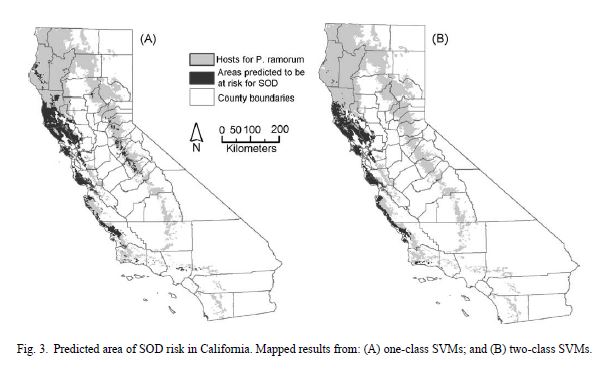
Recently, several types of oak trees in California have been severely impacted by the emergence of Sudden Oak Death, an infectious disease caused by the pathogen Phytophthora ramorum. Using  support vector machine (SVM) approach, researchers provide a prediction for the distribution of sudden oak death with both two class and one class svms.

Researchers argue that a presence only modeling approach, with SVM as an example, will increase the prediction accuracy compared to methods that use a pseudo-absence approach  drawn from the underlying distribution of the presence data. Traditionally, SVMs were designed for two class classification for positive and negative or presence and absence for SDM purposes. However, true absence data is often hard to come by. However, a one class, presence only approach, will have a harder time detecting which environmental features are important in predicting the outcome. To overcome this a one class SVM approach was developed.

The training data for this paper consisted of locations where the occurrence of P. ramorum was confirmed in oaks located in California. Host distribution was generated through Landsat ThemP analysis project which provides information at a fine spatial scale (1:100,0000). 14 Environmental variables were used to train the models, environmental information was provided from Daymet. A five-fold cross-validation method was used to evaluate model accuracy.

SuddenOakDeathFigure


Researchers reported the true-positive rate for your one class SVM was 0.9272 + 0.0460 over an area of 18,441 km2. For the two class SVM reported a true-positive rate of 0.9105 + 0.0712 with a predicted area of 13,828 + 1316 km2. One class SVMs have two main advantages compared to other presence only modeling approached. First, they are able to utilize unique shapes of distributions in feature space through kernel functions. Second, one class SVMs make no assumptions about the distribution of the environmental parameters. Differences in the predicted areas between the two models may indicate that either the one class model has over predicted the area or risk or the two class model has underpredicted. Observed differences can be explained by the higher-true positive rate from the one class model, often false positive rates will increase with the true-positive rate. Another reason for larger risk areas in one class models can be attributed to the two-class model sampling pseudo-absences from presence points, resulting in a more conservative risk estimation. This study demonstrates how a support vector machine approach can be used to ascertain the potential risk of an infectious disease epidemic.

Measuring ecological niche overlap from occurrence and spatial environmental data

Broennimann, Olivier, et al. “Measuring ecological niche overlap from occurrence and spatial environmental data.” Global Ecology and Biogeography 21.4 (2012): 481-497.

  Authors put forth a new method that measures niche overlap between two similar species or the same species but in different geographic regions (endemic and invasive). The framework follows three steps: first calculate the density of species occurrence and of environmental factors along the environmental axes of a multivariate analysis, second  measure the niche overlap along the gradients in the multivariate analysis, and third compute niche equivalency and similarity. To account for differences in sampling strategy, researchers use a kernel density function in the environmental space for species occurrence. The same function is also applied to the occurence of environmental  cells.

a

Comparison of niche overlap is then determined by using the D metric.

b

Where Z1ij is species 1 occupancy and Z2ij is species 2 Occupancy, output varies between 0 (no overlap) and 1 (complete overlap). Comparing the two niches statistically entail investigating niche similarity in two geographic ranges (equivalency) and the same location (similarity).


In order to evaluate the proposed method, researchers conducted a simulation study of two virtual entities with varying degrees of niche overlap. However, the environmental parameters that drive species distribution were based off of climate conditions found in North America and Europe. Researchers also tested the provided method against two cases of species invasion. Finally, researchers compared their framework between species distribution models (EG: MaxEnt) and ordination techniques.

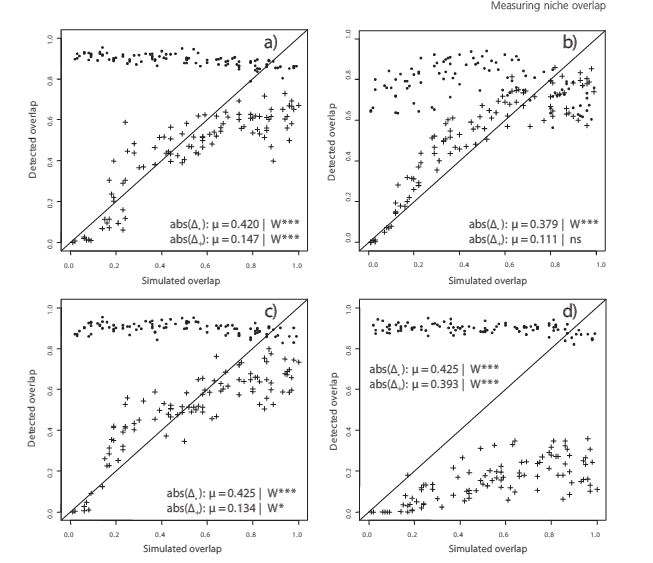
Results in niche detection were variable with traditional SDM methods (figures 3 – 5). Among ordination methods that did not depend on prior grouping, PCA-env performed best on both EU and NA sets of data. No method was considered bester amongst those that depended on prior grouping. For the SDM methods, MaxEnt achieved the best result in measuring niche overlap.

C

Figure 4. Sensivity analysis of simulated versus detected niche overlap for different SDM algorithsm. (a) generalized linear models, (b) MaxEnt, (c) gradiemt boosting machine, and (d) random forests.

Results demonstrate their ability to determine range overlap between and within species. Methods presented here improve on previous first in two ways. First, it removes the dependency of species occurrence from the frequency of different climatic conditions that can occur across a region. Secondly, smoothing species densities allows for species occurrence to be independent of both sampling effort and of the resolution of environmental. Both of these improvements help minimize the influence of of data resolution on the measurement of niche overlap.

Environmental data sets matter in ecological niche modelling: an example with Solenopsis invicta and Solenopsis richteri

Authors: Peterson and Nakazawa

DOI: http://10.1111/j.1466-8238.2007.00347.x

This study highlights the potential effects environmental data can have on model results. The study system selected by researchers was assumed to be a matured species invasion of fire ants where experts were confident that the invading species was approaching its range limit. Researchers compared six different environmental data sets with a genetic algorithm rule-set prediction (GARP) for model development. The different types of rainfall data sets considered were the following: WC1, WC2, IPCC, CCR, and NDVI. GARP operates by sampling available occurrence points (with replacement) to build a population of a set number of presence points, and then an equal number of sampled points of no occurrence. Both sets of occurrence/no-occurrence are then divided equally into training and testing data sets. A drawback to this study is that comparisons are made only qualitatively by depicting predictive differences through mapping, and no quantitative measure of model performance is provided. It is clear from the results offered that different environmental data sets can yield differences in model prediction, yet the authors provided little speculation on possible reasons for such differences.

Interpretation of Models of Fundamental Ecological Niches and Species’ Distributional Areas

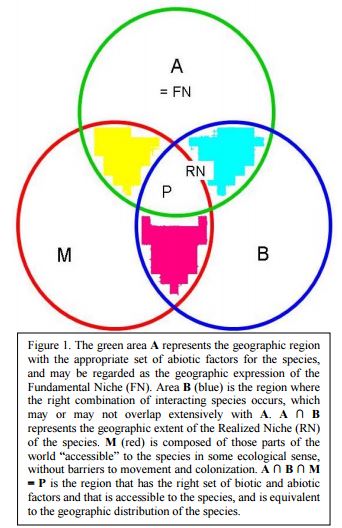
Soberón and Peterson present a discussion that considers two broad ways that researchers generally estimate the fundamental niche of a species. The first method discussed is the mechanistic approach which considers the studied physiology that contributes to positive fitness with information provided from a geographic information system to display suitable habitats. The second method indirectly identifies important characteristics of species fitness by utilizing survey data and climate factors associated with species occurrence. While the first method may provide a deeper understanding of within species drivers that contribute to their distribution, it may neglect the effects of species interactions. While the second method provides opportunity to explicitly model species interactions, yet the correlative approach may be subject to some bias. Soberón and Peterson also consider what role scale plays in species distribution, and how various factors can differ in their importance due to changes in scale. Another consideration is how absence species information needs to be carefully considered with regards to study objective. Lastly, Soberón and Peterson stress the importance for model validation and suggest the need for well developed methods. This paper provides insight into key differences between mechanistic niche modeling and the ‘correlative approach’. However, one improvement to the findings in this paper could be a better developed case study (potentially two) or more mathematical reasoning.

Soberon2005

DOI: http://dx.doi.org/10.17161/bi.v2i0.4