Tackling intraspecific genetic structure in distribution models better reflects species geographical range

Marcer, A., Mendez-Vigo, B., Alonso-Blanco, C., & Pico, F. X. (2016). Tackling intraspecific genetic structure in distribution models better reflects species geographical range. Ecology and Evolution, 6(7), 2084-2097.

DOI: 10.1002/ece3.2010

ece32010-fig-0003

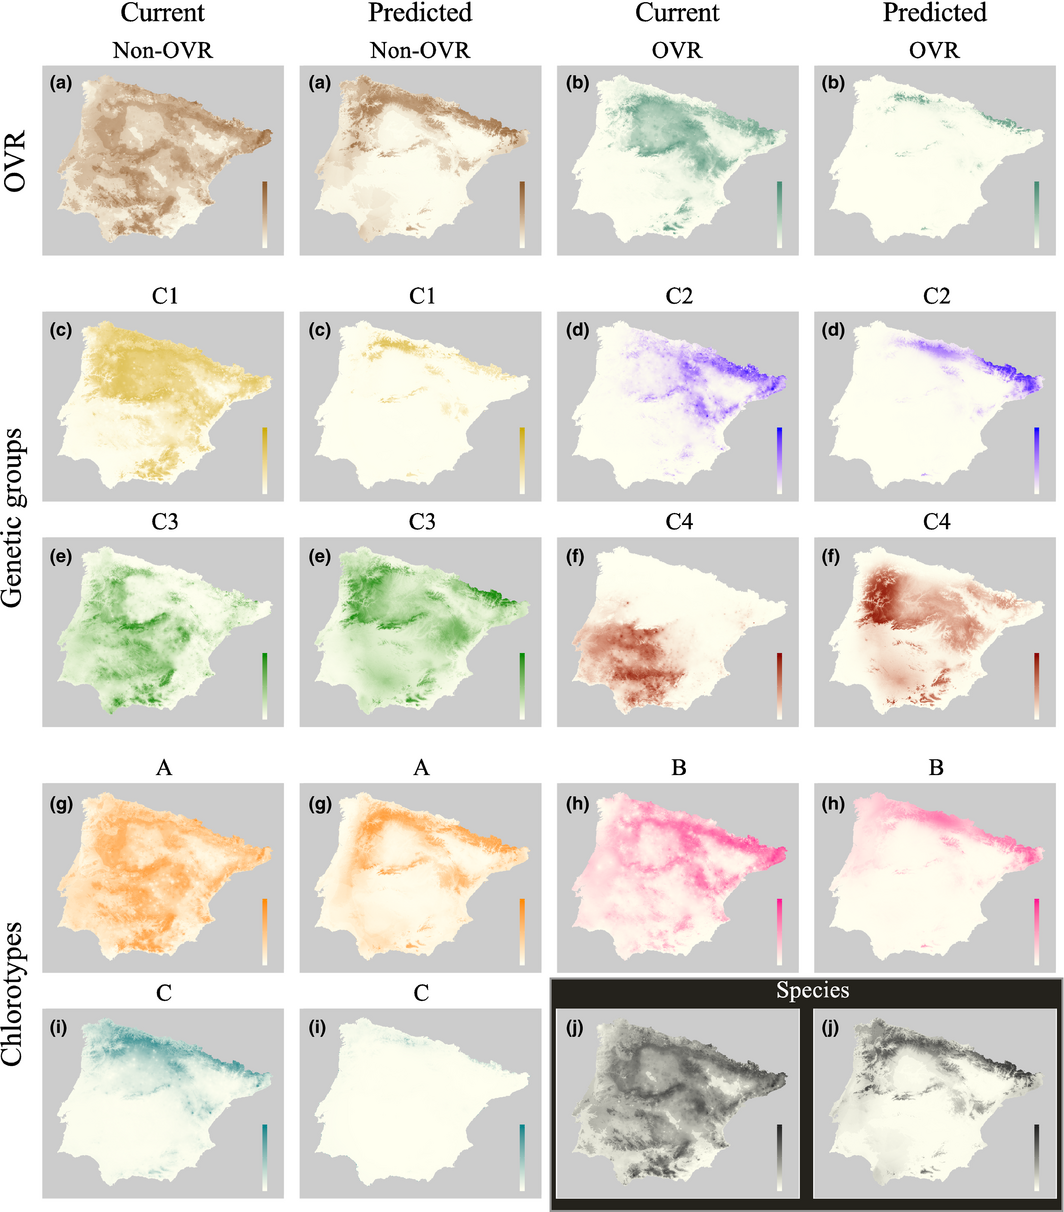
Classical taxonomic designations may not represent the ecological or evolutionary unity that matter to understand the mechanisms that shape biogeographic patterns. Interspecific genetic variation can influence how a species responds to it changes in its environment. This may make genetic variation important in understanding how species distributions will respond to climate change. Work in the Iberian Peninsula has demonstrated that genetic variation in A. thaliana is geographically structured due to the locations of ice age refuges. This study combines SDM with genetic analyses of the plant to determine how SDMs predict the current distribution of A. thaliana genetic units and which environmental variables account for the genetic variation. The species was split into four genetic clusters on the Iberian Peninsula. A MaxEnt model was constructed using three environmental data sources and 279 presence records which correspond to the genetic samples.  The distribution of the species was mainly explained by pH and agricultural land, with the species more likely to occur in acidic conditions. When the model is broken down by cluster variable importance changes from model to model. This highlights the importance of incorporating genetic variation into the predictive model. These units vary in which variables are most important in determining habitat suitability and as the environment changes the species may be influenced in different way throughout its range. By separating the species into distinct genetic units we may be able to understand fluctuations in species distribution better as climates change.

Remotely sensed temperature and precipitation data improve species distribution modelling in the tropics

Deblauwe, V., Droissart, V., Bose, R., Sonke, B., Blach-Overgaard, A., Svenning, J. C., et al. (2016). Remotely sensed temperature and precipitation data improve species distribution modelling in the tropics. Global Ecology and Biogeography, 25(4), 443-454.

DOI: 10.1111/geb.12426


Species distribution models are becoming increasingly popular in many fields of biology. To improve model generality, SDMs are usually built using climatic variables, particularly those from widely available resources like the WorldClim database. These widespread remote sensing databases can be useful in areas that are sparse in station collected data. This study compares SDMs built using WorldClim and CRU data and three publically available remote-sensing derived datasets. The authors examine two aspects of model quality (the models ability to express association between climate and species distribution and model transferability). Models were constructed for 451 species in the tropics using either WorldClim and CRU or using remotely sensed data. Two modeling approaches were used to assess the difference between data sources (MaxEnt and GLM). For WorldClim based models training AUC scores were above 0.7, but AUC scores were only significantly higher than simulated distributions with AUC of 0.5 in 40% of models. When replacing WorldClim data with the remote sensing data AUC values increased and the number of models significantly higher that simulated distributions increased as well. MaxEnt models performed better than GLMs when transferred to a new dataset. Incorporating remote sensing data into the model did not improve transferability over models based on WorldClim data. Modeling species distributions in regions with limited weather stations is difficult. This can be problematic in areas like the tropics where large regions of forest may have very few stations. The inclusion of remotely sensed data can provide coverage to these areas. In general the inclusion of remote sensing data improved the model over just using WorldClim, though in some cases transferability decreased. This suggests that the inclusion of both data types may be the best option to improve accuracy and maintain transferability. This study highlights the applications of remotely sensed climate data, especially in regions where data from weather stations is scarce.


Data prevalence matters when assessing species’ responses using data-driven species distribution models.

Fukuda, S., & De Baets, B. (2016). Data prevalence matters when assessing species’ responses using data-driven species distribution models. Ecological Informatics, 32, 69-78.

DOI: 10.1016/j.ecoinf.2016.01.0051-s2.0-S1574954116000200-gr6

It is widely known that data quality and quantity can influence model accuracy. Studies have also concluded that data prevalence can have an effect on model accuracy, though no studies have examined how data prevalence may influence the habitat suitability inferences drawn from the model. This study looks at how data prevalence affects model accuracy and habitat information retrieved for the SDM using virtual species with varying prevalence. Virtual species were generated from three habitat variables and hypothetical habitat suitability. Data sets were simulated for each species with prevalence of 0.1, 0.3, 0.5, 0.7, and 0.9. Three species distribution models were built for each data set. Model accuracies varied between model type with random forest performing the best, followed by SVM, and then FHSM. Model accuracy responded differently to prevalence between each model type. The error for FHSM models increased as prevalence increased. For random forests the error was influenced more by the data sets than the prevalence. SVM model error exhibited no trend with varying prevalence. Variable importance differed across dataset and prevalence. In general the data models overestimated habitat suitability except for in the case of prevalence equal to 0.1. This study demonstrated the effects of data prevalence on model accuracy. Dependence of model accuracy on data prevalence varied by model. These results may demonstrate a level of robustness of these models to varying data prevalence. When considering which model to use for a species distribution data prevalence may be an important factor to consider as depending on the model uses prevalence can influence the accuracy of the model and the inferences a researcher may draw.  

Community dynamics under environmental change: How can next generation mechanistic models improve projections of species distributions?

Singer, A., Johst, K., Banitz, T., Fowler, M. S., Groeneveld, J., Gutierrez, A. G., et al. (2016). Community dynamics under environmental change: How can next generation mechanistic models improve projections of species distributions? Ecological Modelling, 326, 63-74.

DOI: 10.1016/j.ecolmodel.2015.11.007

1-s2.0-S0304380015005281-gr3

In order to sustain biodiversity and ecosystem services we need predictive models that can reliably project the consequences of climate change and anthropogenic impacts on ecological communities. Currently several approaches exist to predict the impact of climate change on species. Correlative species distribution models relate observations of a species to the local environment and then predict how that distribution may be influenced by a changing environment. Mechanistic or process based models describe biotic and abiotic factors that mechanistically describe the individual and its response to climate change. Due to their structural difference correlative and mechanistic models are well suited to tackle different problems in species distribution modeling. This paper gives an overview of how biotic processes influence species distribution and how these processes alter the projections made by the model. The inclusion of biotic process has three consequences on modeling, (1) an increases in structural realism reflecting the mechanistic knowledge of the system improves model accuracy, (2) insufficient ecological knowledge about the process may increase parameter and structural uncertainty, (3) the additional complexity by incorporating the biotic process may increase uncertainty further. While incorporating relevant biotic processes are likely necessary to achieve the most accurate projects theoretically, if these processes are not adequately informed the added uncertainty could reduce accuracy and make model projections unreliable.  In order to generate models that can reliably project into the future the authors present a protocol for incorporating data into a distribution model. First all relevant knowledge that could inform the projections of current and future species distributions. Next, parameterize all the relevant processes, and attempt to assess the consequences of uncertainty these parameter on you model projections. Next use an iterative loop to identify knowledge gaps and improve the models accuracy. Finally, they recommend communicating the evaluation and interpretation thoroughly to aid in advancement of mechanistic based approaches for large scale species distribution modeling. While mechanistic models may prove to be more accurate in some cases, often we find that the data or knowledge to build these models is insufficient. Correlative models are likely still sufficient particularly in cases where the only data available is presence locations with limited knowledge on the processes that influence the species.

Modelling the oceanic habitats of two pelagic species using recreational fisheries data

Brodie, S., Hobday, A. J., Smith, J. A., Everett, J. D., Taylor, M. D., Gray, C. A., et al. (2015). Modelling the oceanic habitats of two pelagic species using recreational fisheries data. Fisheries Oceanography, 24(5), 463-477.

DOI: 10.1111/fog.12122

fog12122-fig-0004

Species distribution modeling lends a useful tool for describing the environmental requirements of a species and understanding how a species may respond to a changing environment. As these models are built on a combination of presence records and environmental covariates, which are logistically difficult to collect for pelagic species, species distribution models are rarely developed for such species. Fishery catch records, which exist for some pelagic species, are no different from typical presence-only data, except that there is typically no way to quantify fishing effort and as such determining habitat suitability from this data is difficult. This paper seeks to develop a species distribution model for two pelagic species using presence-only fishery data. Poisson point process models are presence-only methods that model intensity of the points per unit area as a proxy for relative abundance. Data for presence of dolphinfish and kingfish were acquired from the New South Wales Department of Primary Industries catch and release program. Environmental covariates were extracted from the Spatial Dynamics Ocean Data Explorer for presence and pseudo-absence points. A PPM was constructed to predict the distribution of each species as a function of environmental covariates with the presence and pseudo-absence points acting as the binary response variable. All environmental covariates were retained by the model which predicted fish intensities for both species reasonably well (AUC 0.80 and 0.81 for dolphinfish and kingfish respectively). Dolphinfish intensity increased along the coast during the summer and autumn, while kingfish intensity shifted south during the summer and autumn. These results show a strong relationship between pelagic fish distribution and ocean environmental variables, along with seasonal shifts in distribution for these species. This study successfully implemented species distribution modeling with a novel data collection strategy by using fishery catch data. This approach to species distribution modeling can be particularly applicable to managers whom wish to understand the distribution of the species they are managing as well as the abundance of that species across the region.   

Dynamic occupancy models for analyzing species’ range dynamics across large geographic scales

Bled, F., Nichols, J. D., & Altwegg, R. (2013). Dynamic occupancy models for analyzing species’ range dynamics across large geographic scales. Ecology and Evolution, 3(15), 4896-4909.

DOI: 10.1002/ece3.858

Through expanding citizen science efforts the large-scale biodiversity data required to predict species responses to global climate change are becoming increasingly available. But, drawing inferences from these large-scale data sets can be difficult as the data can be heterogeneous simply due to difficulties in collecting data in a standardized way. There is a need for a robust method to analyze the data that can account for variation in observation processes and spatial correlation. This paper seeks to develop a hierarchal occupancy model to analyze bird data collected across the southern portion of Africa. The use of this model is then illustrated by applying it to a study of the range dynamics of the hadeda ibis. To monitor bird species in southern Africa two atlas projects were established, in which citizens reported occurrence of species through species lists to a database. A hierarchical occupancy model was established to model occupancy at three levels (distribution at the scale of each atlas project, the yearly occupancy within each project, and the detection/non-detection on yearly use). The model was implemented on hadeda ibis, a large conspicuous bird that is unlikely to be mistaken for another species. The ibis had high occupancy probabilities across the ranges of both projects, with occupancy increasing from project one to project two. Based on geographic location of these projects this result reflects a range expansion of the ibis. This occupancy model for biodiversity data is conceptually similar to GAM-based species distribution models. As efforts for collecting data over larger extents continue this occupancy model will be useful in analyzing the data and allowing the researcher to address larger scale questions. This paper developed an occupancy model that utilized a citizen science project and demonstrated how the model could be used to study the range dynamics of a specific species. The authors conclude that the model could be used to answer many different macroecological questions and that range dynamics is just one example of how this occupancy model can be implemented.

Species distribution models grounded in ecological theory for decision support in river management

Bennetsen, E., Gobeyn, S., & Goethals, P. L. M. (2016). Species distribution models grounded in ecological theory for decision support in river management. Ecological Modelling, 325, 1-12.

DOI: 10.1016/j.ecolmodel.2015.12.016

1-s2.0-S0304380015005918-gr2

River managers must restore their systems with limited budgets and answer to conflicting stakeholders, and as such can be subjected to increased scrutiny. When planning restoration it is important to understand the stressors within the system and as such there has been more effort applied to the development of ecological models in European river systems. These models are often more related to ecological quality indices than actual species distribution models. While SDMs are often used to assess impacts of stressors on a system, the difficulties in modeling multiple species within the system has made application in riverine conservation difficult. The authors present a model for which they use species distribution of multiple species to assess the environmental condition of rivers throughout the landscape. This project comprised of six steps, (1) development of model concept, (2) data exploration and preparation, (3) construction of habitat suitability indices, (4) implementation of model concept, (5) model selection and assessment, and (6) meta-analysis of model results. The authors built a general model concept in which environmental stressors act as hierarchical environmental filters upon the realized species assemblages. This model is structured as abiotic filters in the form of habitat suitability indices which result in possible species assemblages. The model included 34 environmental variables to explain species assemblages. Habitat suitability indices were derived for each univariate from the trapezoid curve of the species distribution along an environmental gradient. In order to predict the presence of a species, HSI were combined as limiting abiotic filters. If HSI scores were low for many environmental variable the probability of presence of a species would decrease. Four models were constructed (one with just abiotic factors, one that included a geographic filter, one that included interactions of parameters, and one that included both the geographic filter and the interactions of parameters) to test the effect of model structure on prediction. HSIs were constructed for 92 taxa. The model that included both the geographical filter and the interaction parameter had the best performance. All models showed high agreement with known species distributions and ecological knowledge of individual species. Model performance differed strongly between species and as there is no relationship between how well a model agrees with ecological knowledge and the final model performance; improvements to the HSI are unlikely to improve model performance. The inclusion of stakeholders in model development resulted in credible and acceptable models which are able to handle multiple species at once and aid in the prediction of species assemblages across river systems. This type of species distribution relies heavily on prior knowledge regarding species response to environmental stressors, and as such differs from modern species distribution approaches. While this model can be easily interpreted and may be more likely to be accepted by stakeholders in the management of these rivers, more modern algorithmic based models may provide better prediction of species distributions in the system.   

The effects of model and data complexity on predictions from species distributions models

Garcia-Callejas, D., & Araujo, M. B. (2016). The effects of model and data complexity on predictions from species distributions models. Ecological Modelling, 326, 4-12.

DOI: 10.1016/j.ecolmodel.2015.06.002


1-s2.0-S0304380015002513-gr3

Species distribution models involved statistical or numerical methods that relate distributions of a species with layers of environmental data. While tests of SDM performance have concluded that more complex models are generally better than simple models, performance may be inflated when test data are not independent from training data, such as when data is randomly split into test and training data sets. The few studies that have tested transferability of models on completely new data have found no relationship between complexity and model performance. Delineation between simple and complex models can be difficult. Typically simple models are thought of as easy to comprehend and perform simple computational operations. Complex models have several layers of complexity that play a role in making them difficult to comprehend. First complex models may require a complex algorithm that uses a relatively large amount of computational resources. These models are referred to as time or algorithmic complex. Another source of complexity can be found in data complexity. The influence of data complexity on model performance has not been formally explored though the authors predict that simple data sets are likely easier to model and as such should yield better performance than models trained on complex datasets. To explore the influence of complexity on model performance the authors simulated the distribution of three species using a set of environmental covariates. Eight modeling methods were considered (BIOCLIM, GLM, GAM, MARS, Maxent, BRT, random forest, SVM) in evaluation model performance with varying complexity. A linear relationship existed between dataset size and computation time; the slope of which differed by several orders of magnitude across model type. AUC scores were significantly influenced by model technique with MaxEnt and GAM performing the best with no transferability. AUC scores were consistently lower when temporal transferability was implemented. AUC scores were significantly correlated with data complexity for all models with no transferability. When temporal transfer occurred AUC scores were only correlated with data complexity for MARS, MaxEnt, BRT, and Random Forest. Consistent with expectations data complexity was inversely related to model performance. Model complexity was not related to model performance contrary to expectations. While model complexity did not predict performance of the model, data complexity did. This study highlights the importance of considering the type of data being used to develop the model, particularly as it relates to the complexity of the data. In cases where complex data is being utilized model selection is important in ensuring good predictive performance.

Modeling the spatial distribution of the seagrass Posidonia oceanica along the North African coast: Implications for the assessment of Good Environmental Status

Zucchetta, M., Venier, C., Taji, M. A., Mangin, A., & Pastres, R. (2016). Modelling the spatial distribution of the seagrass Posidonia oceanica along the North African coast: Implications for the assessment of Good Environmental Status. [Article]. Ecological Indicators, 61, 1011-1023.

DOI:10.1016/j.ecolind.2015.10.059

base_mappe_CS2.3ai

Anthropogenic use of marine habitats has the potential to degrade these environments. Identifying regions that are either heavily degraded or relatively pristine is critical to establishing conservation priorities. Ecological indicators, including abiotic and biotic factors, offer methods for determining the health of the ecosystem. While measurements for abiotic factors may be readily available across a large region through remote sensing, biotic data can be scarce. This paper explores the use of a species distribution model for an indicator species as a method for identifying regions of relatively low impact along the North African coast. A bionomial generalized linear model was fit using presences/absence data for P. oceanica, a seagrass, and a collection of environmental variables. The models identified coastal regions as having high probability of suitable habitat, particularly along the Tunisian and Libyan coasts. In order to assess impact in an area the potential distribution indicator was developed. This indicator is the ratio of predicted distribution of the species to actual observations of the species in the area. Areas where the ratio of actual presence to predicted presence is close to one may be considered to have low impact, where areas with ratios much lower than one may be experiencing sever human impacts. This study demonstrates a method for the use of remote sensing data to assessing regions of low and high anthropogenic impact. These methods appear particularly applicable for those that wish to assess ecosystem health across a large extent, but due to assumptions made regarding the development of the indicator derived from the species distribution model, local ground truthing of environmental health may still be required at the local scale.

Transferability of species distribution models: The case of Phytophthora cinnamomi in Southwest Spain and Southwest Australia

model_projections_transferability
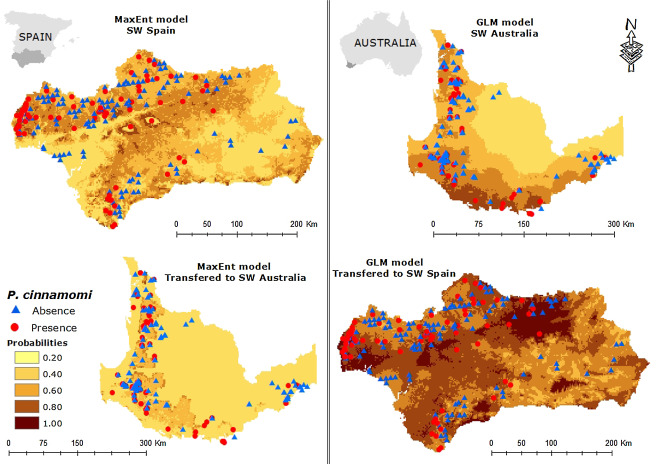
Duque-Lazo, J., van Gils, H., Groen, T. A., & Navarro-Cerrillo, R. M. (2016). Transferability of species distribution models: The case of Phytophthora cinnamomi in Southwest Spain and Southwest Australia. Ecological Modelling, 320, 62-70.

DOI: 10.1016/j.ecolmodel.2015.09.019

Species distributions may be assessed through interpolation for contiguous/adjacent areas without species occurrence, extrapolation for a geographic range wider than the calibration area of the model, or transferring a model calibrated in one region or time period to a disjunctive region or to a different period. Transferability of SDMs can be helpful in assessing the impacts of climate change on biodiversity, but transferability performance of SDMs between two disjunctive areas is poorly understood. This paper seeks to determine if models that are locally highly accurate are also better when transferred to a disjunctive area, identify which SDM algorithm(s) achieve the best transferability accuracy, and if model transferability accuracies depend on the number of variables included in the analysis. Using presence data for a species found across the world, models were constructed separately for two different regions (Spain and Australia). Models trained and calibrated in Spain were transferred to Australia and vice-versa. The transferability accuracy was calculated as an accuracy index in which the accuracy of the model when transferred was divided by the accuracy of the model within its training region. Models trained in Spain resulted in higher AUC values than those trained within Australia. GAM and GLM models were best transferred across the continents, though MaxEnt was the most stable model when transferred. Models transferred to Spain were more accurate than those transferred to Australia. This difference in transferability between models trained in different regions may be due to differences in value ranges in environmental variables. To reduce this uncertainty it is recommended that both the similarity in the mean value of variables and the range of the variables values be standardized across regions. While models developed in Spain showed high predictive performance within the training area, this performance did not translate to high transferability; indicating that high predictive performance does not guarantee high transferability. GLMs performed well within both the training region and the disjointed region transferring in both directions, while MaxEnt performed well in both training regions, but only transferred well in one direction. The ability to apply models outside of the training extent may allow us to understand more about how climate change will influence biodiversity and species distributions in the future, but we must address the uncertainties presented by predicting on environments that contain vastly different distributions of environmental conditions when compared to the training region as this can influence the predictive performance of the model.