Do they? How do they? WHY do they differ? On finding reasons for differing performances of species distribution models

Elith, J., & Graham, C. H. (2009). Do they? How do they? WHY do they differ? On finding reasons for differing performances of species distribution models. Ecography. http://doi.org/10.1111/j.1600-0587.2008.05505.x

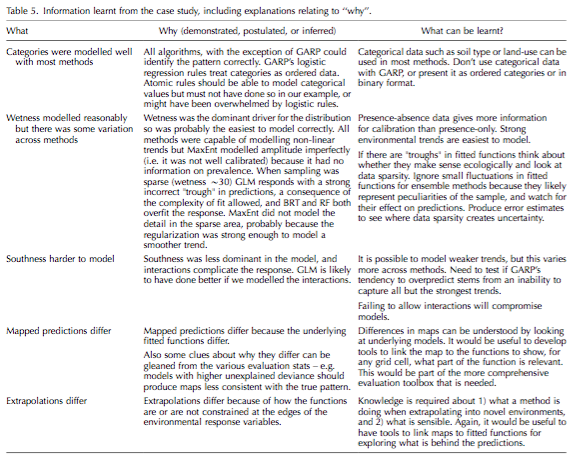
With the expansion of SDM has come an increasing emphasis on machine-learning models, however there are few resources available for newcomers to help guide which models to choose for which application, or end goal. As a first step in creating such a guide, Elith & Graham use a simulated plant presence-absence data set and assessed the success of five algorithms to achieve three common goals in SDM: 1) understanding the relationship between a species and its environment, 2) creating a map of habitat suitability, and 3) extrapolating to new environmental conditions. The five algorithms were a generalized linear model, boosted regression trees, random forests, MaxEnt, and GARP, the last two using presence-only data. They compared each algorithm’s performance for each of the three applications of SDM, using four different measures of statistics. Their results are summed up in the table below, and I’m not going to rehash them here. An important conclusion they drew from their comparisons, however, are that the researcher must have an understanding of the algorithm they are using and the ecological background of their system in order to choose the best model for their application and system. For example, GARP does not model categorical variables well, and presence only models may not be well calibrated depending on the range of suitability. I found it interesting that, even though these algorithms still represent a ‘black box’, a user’s understanding of their strengths and weaknesses will allow the user to better interpret the somewhat subjective output in choosing a model of ‘best fit’ for their chosen goal.
Screen Shot 2016-02-08 at 6.35.33 PM

Demographic compensation among populations: what is it, how does it arise and what are its implications?

Villellas, J., Doak, D. F., García, M. B., & Morris, W. F. (2015). Demographic compensation among populations: what is it, how does it arise and what are its implications? Ecology Letters, 18(11), 1139–1152. http://doi.org/10.1111/ele.12505

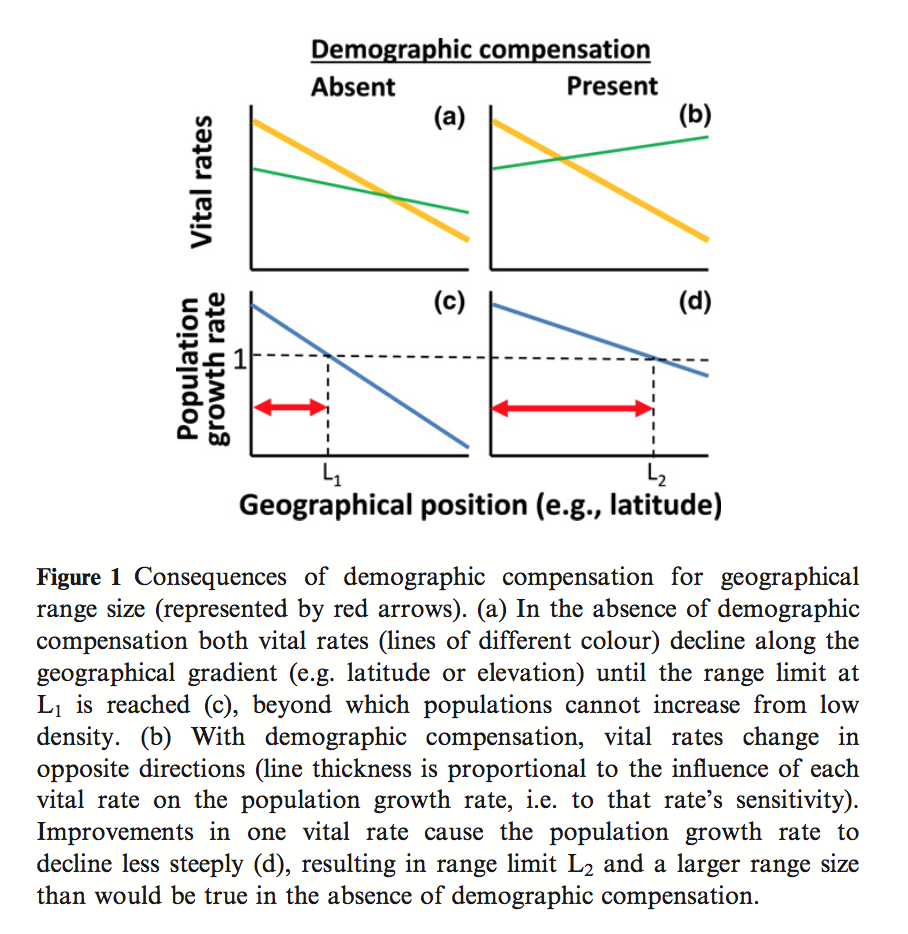
A common assumption in the analysis of species distributions across an environmental gradient are that vital rates decline across the gradient as they approach the range limit. Villellas et al. aimed to investigate an opposing theory, demographic compensation (DC), in which mean population vital rates change in opposing ways across spatial or environmental gradients. Using a randomization procedure, they tested for the presence of DC across 26 plant demographic studies, based on the assumption that DC would lead to more negative correlations among vital rates than expected by chance. They found both that there were more positive and more negative correlations than expected by chance, suggesting that the overall tendency is for vital rates to respond similarly, but that DC is a phenomenon that does exist. Investigating further, this pattern was driven by fecundity and recruitment rates, which had the highest proportion of negative correlation amongst vital rates and to which the population growth rate had high variance and sensitivity, respectively, evidence that DC acts by influencing vital rates as different life stages. For those studies that showed evidence of DC, another randomization procedure was done to compare the variation of population growth rates with a nd without DC, finding that DC halved the variance in population growth rates. This has important implications for SDM, as high growth rate variation at the range limits of species distributions can lead to a higher rate of stochastic extinctions, perhaps influence presence data and the probability of persistence in these limits. If we are to believe that DC is at play, however, there will be less variation at the range limits, implying that the ‘e-space’ may be closer to Hutchinson’s binary persistence-extinction demarcations than originally thought.

Screen Shot 2016-02-01 at 6.05.08 PM

Evolutionary diversification, coevolution between populations and their antagonists, and the filling of niche space

Ricklefs, R. E. (2010). Evolutionary diversification, coevolution between populations and their antagonists, and the filling of niche space. Proceedings of the National Academy of Sciences, 107(4), 1265–1272. http://doi.org/10.1073/pnas.0913626107

It is difficult to think about ecological niches without considering the consequences for species coexistence and biodiversity. Stemming from this is the idea of “niche filling”, in that a finite niche exists and because one species is already “filling” it, another cannot persist in the same niche at the same geographical location. This has led to the theory of an equilibrium number of niche spaces, whereby diversification in one clade is balanced by a decrease in diversity in other clades. Ricklefs tested this hypothesis by analyzing several datasets of bird clade diversity and range sizes, predicting that if the hypothesis holds true, the total niche space per clade would scale with the species diversity. His results found that this was not the case, predicting this independence of niche space may be due to higher clade overlap and smaller niche space for individual species within high-diversity clades. The constraint on niche space, Ricklefs proposes, may be caused by the coevolution of pathogens. As pathogens co-evolve with their host, they keep the niche space of one particular species from expanding too broadly, thereby allowing for a higher diversity of closely related species. In the field of niche theory, the inclusion of pathogens is novel, as the ‘boundaries’ of niche space are conventionally defined by competition interactions or resource limitation. The inclusion of both pathogens and co-evolutionary dynamics in the defining of a species niche space represents an important, although somewhat daunting, step towards a further understanding of niche theory. Ricklef’s theory is based on the idea that ‘diversity begets diversity’ evolutionarily and that pathogens are host-specific and respond to the co-evolutionary arms race, otherwise known as the Red Queen Hypothesis, by host switching, and I am doubtful how often this is seen in nature.

Physiographically sensitive mapping of climatological temperature and precipitation across the conterminous United States

Daly, C., Halbleib, M., Smith, J. I., Gibson, W. P., Doggett, M. K., Taylor, G. H., et al. (2008). Physiographically sensitive mapping of climatological temperature and precipitation across the conterminous United States. International Journal of Climatology, 28(15), 2031–2064. http://doi.org/10.1002/joc.1688

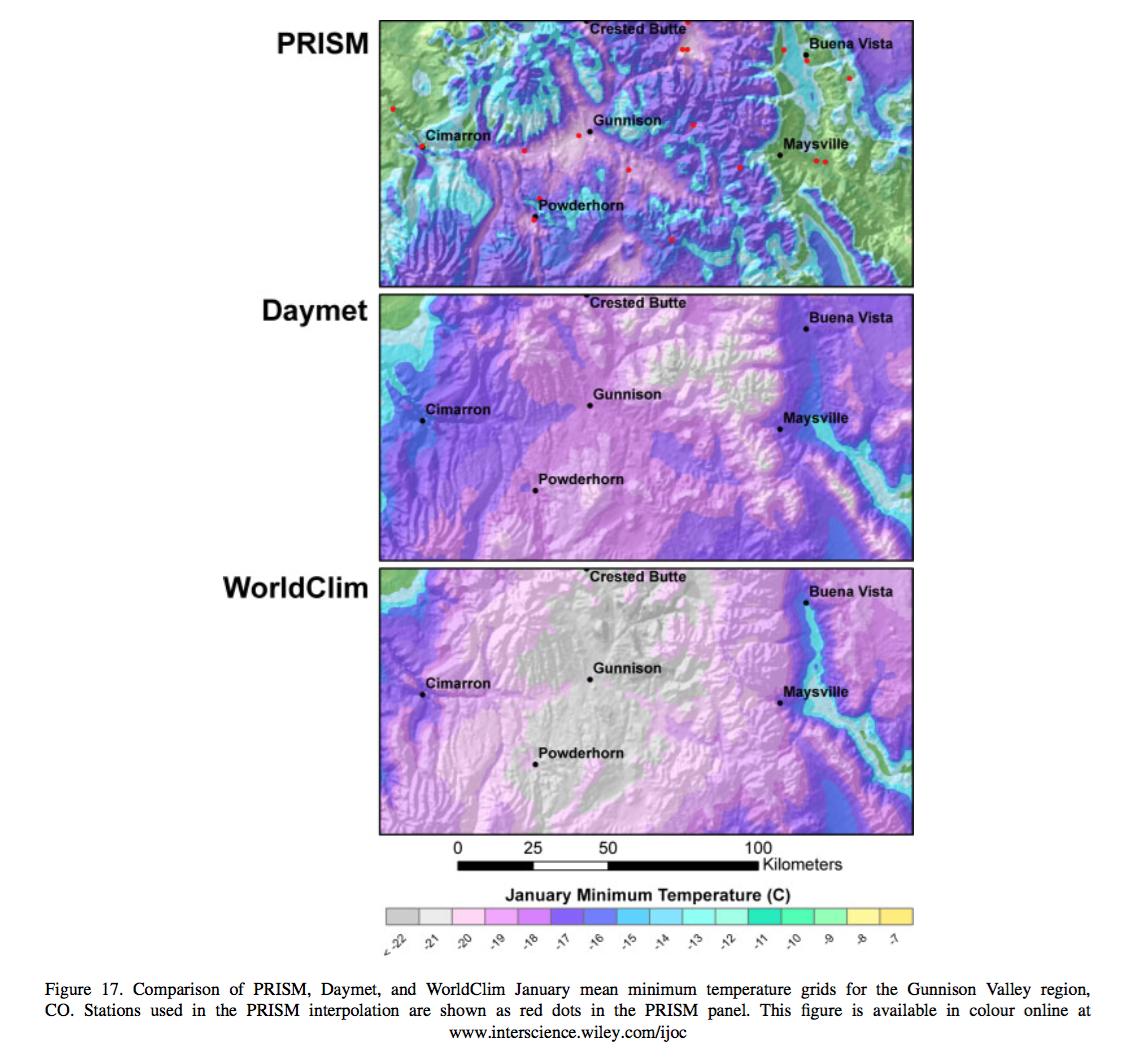
Daly et al. created a 30 arc-sec climate map of the continental United States, mapping mean monthly precipitation, and minimum and maximum temperature, referred to as the PRISM map. Similar to other models, they interpolated point weather station data from 1971-2000 over a grid using a climate-elevation regression. Station data was weighted based on nine PRISM algorithms that incorporated spatial clustering and relevant topographic data, including coastal proximity, temperature inversion potential, and location on topographic slopes. Including data such as this allowed the model to more accurately predict local climatic events such as temperature inversion in valleys and rain shadows. To clean and validate the data, local experts were brought in for each region, in addition to manual exclusion of extreme and data errors. Daly et al. used two measures of uncertainty to evaluate their model, jack-knifed cross-validation and a 70% regression prediction interval. Error was highest in the more physiographically complex areas of the US, as expected, and the two measures performed similarly with increasing area scale. When compared to Daymet and WorldClim, PRISM better predicted temperatures at high elevation, because of its inclusion of the two-layer temperature inversion, while Daymet and WorldClim had a cold bias in these areas. Additionally, the inclusion of regional coastal algorithms for the different coasts of the US led to more accurate depictions of coastal temperatures in California than the other maps. In less complex areas, such as the MidWest, however, all three maps performed similarly. The inclusion of more topographic complexity in PRISM is an improvement over similar climate grids of the US, especially in the Pacific Northwest, but offers little benefit in areas of shallow elevation gradient in the middle of the country. When available, it seems logical and worthwhile, in my opinion, to include this additional complexity, as climate is not solely dependent on elevation and does not incorporate finer scale differences.


Because they do not have temperature inversion along slopes, both Daymet and WorldcClim have a strong cold bias at high elevations.
Because they do not have temperature inversion along the elevation gradient, both Daymet and WorldClim have a strong cold bias at high elevations.

Competitive Interactions between Tree Species in New Zealand’s Old-Growth Indigenous Forests

Leathwick, J. R., & Austin, M. P. (2001). Competitive Interactions between Tree Species in New Zealand’s Old-Growth Indigenous Forests. Ecology, 82(9), 2560–2573. DOI: 10.2307/2679936

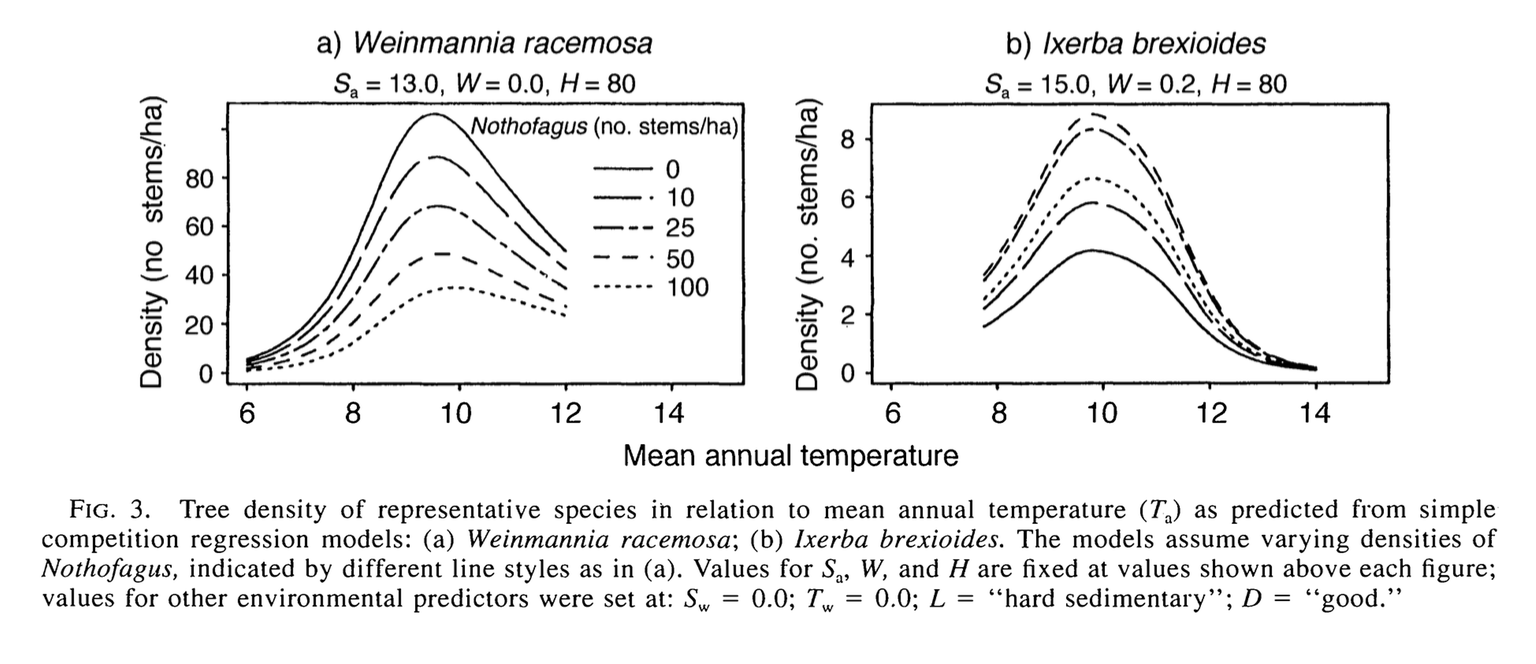
A major limitation of current species distribution models is the exclusion of biotic predictors and species interactions in models. It is difficult to separate the spatial patterns of species interactions and environmental covariates in a model because the distribution of non-focal species is itself dependent on environmental covariates. The Nothofagus forests of New Zealand, however, present an ideal natural experiment, because their species distribution is based on historical landscape shifts, not environmental covariates, enabling the inclusion of Nothofagus presence- absence in a model without confounding the abiotic covariates. To examine the contribution of species interactions to SDMs, Leathwick and Austin fit GAMs to New Zealand tree species, including both environmental factors and presence-absence of Nothofagus species, and the interaction between environmental variables and competition. Environmental regressions in the absence of competition were first created for each species. Terms describing Nothofagus density and an interaction between Nothofagus density and temperature were then added to the regression. A reduction in deviance due to the addition of a term was interpreted to mean that the factor did influence the focal species distribution. The addition of competition significantly reduced the deviance for all species, and did so on a larger magnitude than did the environmental covariates, except for mean temperature, suggesting that competition significantly impacts species distributions. Additionally, including competition in the SDMs led to an upwards shift in species’ optimal temperature. The authors validated their model by comparing predictions using environment-only regressions and environment-competition regressions for two data sets. The environment-competition model seemed to predict species distributions more accurately, but this accuracy was not assessed quantitatively. Leathwick and Austin’s results suggest that future SDMs must take into account more realistic species interactions, as in some cases, they influence species distributions WORD at least as much as environmental covariates. However, their reliance on reduced deviance as proof of the role of competition could be improved upon by using a more rigorous, quantitative training method. Further work exploring the interaction between competition and environmental covariates, and that competition potentially alters the thermal niche of species, should be done and would be especially relevant in the face of climate change.

Inclusion of Competition in Models Led to Decreased Density of Focal Species