Predictive distribution modeling with enhanced remote sensing and multiple validation techniques to support mountain bongo antelope recovery

Estes, L. D., et al. “Predictive distribution modeling with enhanced remote sensing and multiple validation techniques to support mountain bongo antelope recovery.” Animal Conservation 14.5 (2011): 521-532.

DOI: 10.1111/j.1469-1795.2011.0045

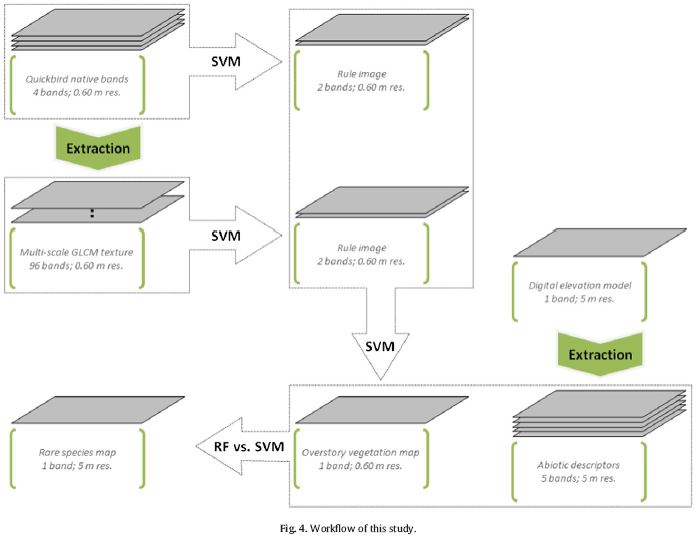
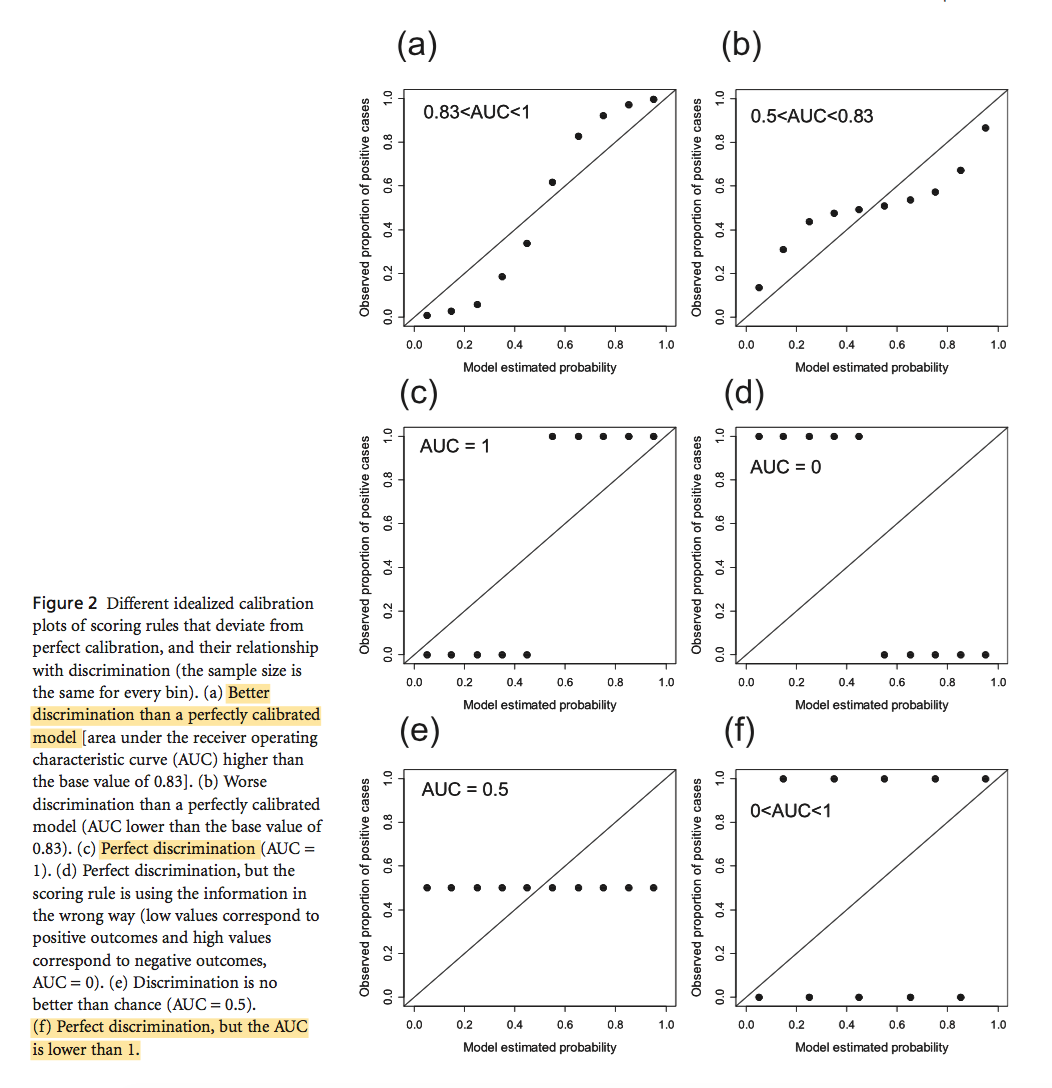
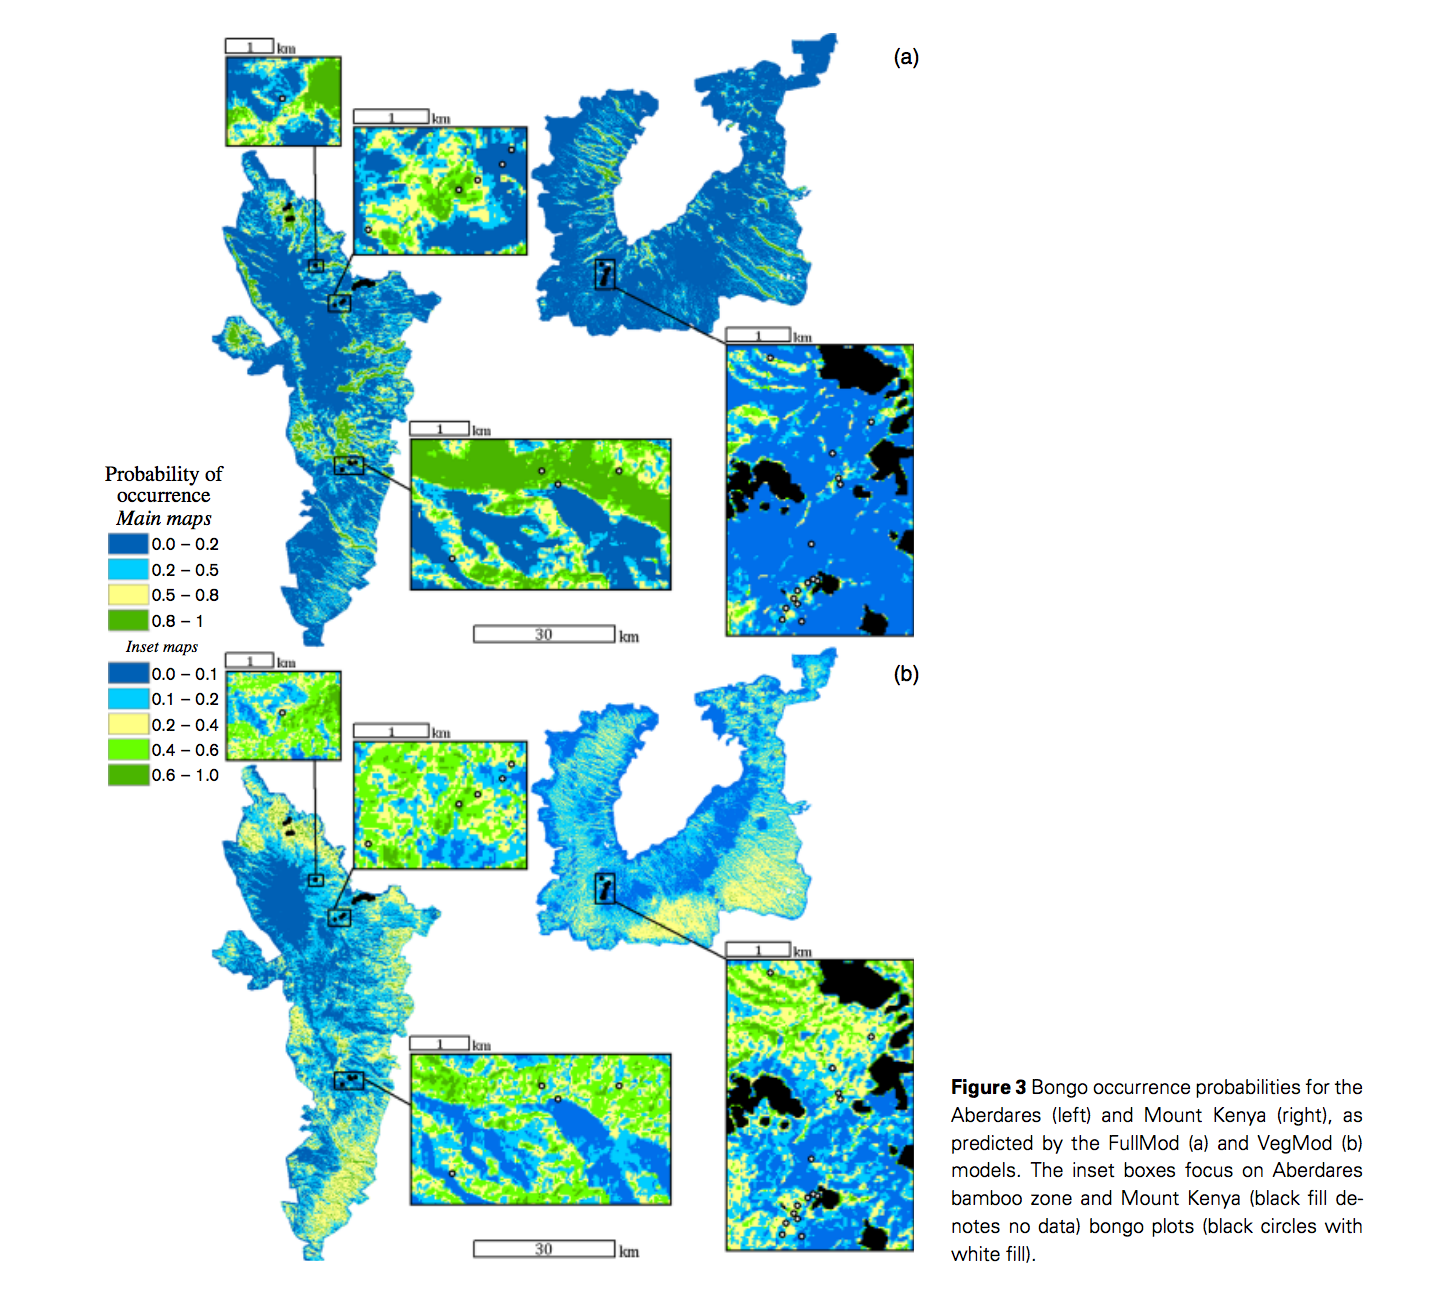
Transferable predictive distribution model is based on predictors describing the ranges and scales of relevant environmental gradients It is able to predict distributions of habitat use so that to facilitate species recovery. Estes et al used logistic regression modeling approach for a rare species, mountain bongo, to understand their special ecology of habitat use and to assist species recovery in Mont Kenya and Aberdares. One common problem for species distribution modeling for rare species is data limitation. They used remote sensing derived quantitative vegetation structure maps, moisture, and ruggedness as transferable habitat predictors. Totally 31 logistic linear regression models were constructed and tested using AIC values. A DNA analysis was applied to verify observations of bongo. They also used independent observations from Mont Kenya to assess the transferability of the model. The models showed ruggedness was the most important variables for habitat use, indicating their strong preference to difficult terrain. Bongos also prefer sites that closer to the patrol route of park rangers and that have complex vegetation structures. However, predictors are sources of model bias when transfer models between habitats, such as over-parameterization and spatio-temporal variation in species-environment relationships. Estes et al stated that bongo habitat associations should not differ greatly between two habitats, but the environmental variations between mountains caused the limited transferability of the mountain. As predictors, elevation is indirect as oppose to vegetation and moisture, which are directly related to habitat use. A direct measures of predation risk and food plant abundance and using better-sourced remote sensing imagery would improve this model, which is highly dependent on remote sensed data.

Screen Shot 2016-05-01 at 8.58.15 AM

Harnessing the World’s biodiversity data: promise and peril in ecological niche modeling of species distributions

Anderson, Robert P. “Harnessing the world’s biodiversity data: promise and peril in ecological niche modeling of species distributions.” Annals of the New York Academy of Sciences 1260.1 (2012): 66-80.

DOI: 10.1111/j.1749-6632.2011.06440.x

The advances in stores of biological and environmental data (presence-only data) from museums facilitate species niches and geographic distribution modeling, which offers key insights for conservation biology, management of invasive species, zoonotic human disease, and other pressing environmental problems. However, the full utility of niche modeling remains under-realized, which mainly lies in both the incomplete availability of the occurrence data (1, incorrect taxonomic identifications; 2, lacking or inadequate databasing and georeferences; 3, effects of sampling bias across gepgraphy) and the nascent nature of the field, with few researchers well trained conceptually and methodologically (i.e. 4, selection of the study region; and 5, model evaluation to identify optimal model complexity). The authors highlighted that the critical applications of museum data via SDM represent an opportunity for museums to contribute information and solutions to key societal issues, as well as a compelling justification for investment in the taxonomic studies of biodiversity. The selection of the study region for model calibration represents a topic of great importance. Studies show that environmental data from regions that may hold suitable conditions but in which the species is absent for other reasons should not be included in background samples. To be specific, the absence may be due to dispersal barriers or because biotic interactions. Although limited numbers of studies take into account paramount principles of study-region selection and extrapolation in environmental space, they have been stated clearly in literature. Finally, researchers should elaborate good performance for SDM before interpreting and using them for applications, including whether the model predicts independent data well and whether it has the ability to predict across time and/or space. The author claimed for a necessity to produce a much larger number of scientists capable of building and applying high-quality SDM, as well as a broad community able to acknowledge their quality and utility. I highly agree with the author that SDM is on its way to thrive and making practical contributions for biodiversity studies. One of the first-hand experiences I have during this semester is that there are still barriers between researchers from different traditional “disciplines”, both in understanding of theory or technology. Epitomizing the interdisciplinary nature of the field is critical to promote further development of SDM and biodiversity informatics.

Moving beyond static species distribution models in support of conservation biogeography

Franklin, Janet. “Moving beyond static species distribution models in support of conservation biogeography.” Diversity and Distributions 16.3 (2010): 321-330.

DOI: 10.1111/j.1472-4642.2010.00641.x

SDM extrapolates species locations in space based on correlations of presences with environmental variables. Nonetheless, most of the SDM are static, assuming species locations data used for modeling are representative of its true distribution, and distributions are in equilibrium with environment factors. In order to meet the needs of conservation biogeography, static SDM needs to move to incorporate dynamic processes determining species distribution. Franklin therefore discussed three strategies of increasing complexities for SDM incorporating process models, namely 1) to incorporate models of species migration to understand the ability of species to occupy suitable habitat in new locations; 2) to link landscape disturbance and succession to suitability; 3) to link suitability models with habitat dynamics and population dynamics. Generally, migration models account for species dispersal and establishment, but not account for interactions with other species. Both population viability models and community dynamics models account for dispersal and competition. However, there will always be trade-offs between using complex, mechanistic versus simple, empirical models for environmental change forecasting. By linking all modeling complexities, the framework could be powerful to understand the potential interactions and population persistence. But good knowledge of species interactions and life history is required. Most notions in this paper are at conceptual level, though he brought up a really good point to combine dynamics into SDM. However, in many cases we use SDM is to compensate for our lack of knowledge on the ground. Hopefully we can see some specific applications that include dynamic variables into species commonly used SDMs, and maybe a comparison can be made in terms of which model is more compactible with dynamic processes.

Consequences of spatial autocorrelation for niche-based models

SEGURADO, P., ARAÚJO, M. B. and KUNIN, W. E. (2006), Consequences of spatial autocorrelation for niche-based models. Journal of Applied Ecology, 43: 433–444. doi: 10.1111/j.1365-2664.2006.01162.x

Spatial autocorrelation is an important bias source in most spatial analysis. Segurado, Araujo and Kunin (2006) examined the bias caused by spatial autocorrelation based on explanatory and predictive power of niche-based species distribution modes. Two kinds of freshwater turtle and two simulated species were used to construct SDM using generalized linear models (GLM), generalized additive models (GAM) and classification tree analysis (CTA). In general, GAM and CTA outperformed GLM, though all of them are vulnerable to the effects of spatial autocorrelation, which leads to an inflation effect up to 90-fold. Efforts for reducing autocorrelation effects included systematical subsampling and inclusion of a contagion term. Subsampling was only partially successful in avoiding inflation effect, whereas the inclusion method fully eliminated or sometime even overcorrected the effect. Based on this study, they recommended to implement techniques and procedures like the null model approach in order to improve niche-based SDM performance. However, their discussion is limited only to univariate modeling. When more then one candidate variable to predict SDM, a more complex assessment needs to be considered. However, since SDM are usually multivariate, their conclusion may still be able to offer informative rules, but to which level autocorrelation will affect SDM, or which model perform better may need further exploration.

Is my species distribution model fit for purpose? Matching data and models to applications

Guillera‐Arroita, Gurutzeta, et al. “Is my species distribution model fit for purpose? Matching data and models to applications.” Global Ecology and Biogeography 24.3 (2015): 276-292. DOI: 10.1111/geb.12268

While Species distribution models are widely used to for ecological, biological and conservation applications, researchers often lack of considerations how fit their data, model output and end-use are. SDM is flexible to be built under different types of species data, how sample process, data type, and modeling approaches influence the use of SDMs is lacking. Guillera-Arroita provided a simple framework that summarizes how interactions between data type and the sampling process may determine the quantity estimated by a SDM. They mainly talked about three types of data: presence-background, presence-absence and occupancy-detection. Our ability to deal with the probability of occupancy, the probability of site being surveyed and species detectability depend on data type being used, and this in turn determines what SDMs can estimate. By reviewing current literature and simulations, they found that even though model predictions fitted the most commonly available data, some requires estimates of occurrence probability, which is only possible with reliable absence data. When converting continuous SDM output to categorical presence/absence, it cannot clearly justify and degrade inference.


They claimed a transparent decision-making framework needs to be carried out, and people need to first formulate a clear objective. A critical consideration of using SDM is 1) whether the type of information demanded by the application in question is available, 2) whether the type of data allows unbiased estimation when used in appropriate modeling methods, and 3) thinking about the type of data that a SDM is expected to provide for a given application. This paper raises the attention for SDM users to consider whether the SDM outputs fit their research purposes, especially when continuous-binary conversion needs to be carried out. It would be interesting to see a clear decision-making framework in terms of how this kind of conservation can be justified or how to set the threshold for conversion for different ecological and conservation applications. In addition, efforts are always in demand to develop survey methods that is able to minimize the effects of the sampling process.

POISSON POINT PROCESS MODELS SOLVE THE “PSEUDO-ABSENCE PROBLEM” FOR PRESENCE-ONLY DATA IN ECOLOGY

Warton, David I.; Shepherd, Leah C. Poisson point process models solve the “pseudo-absence problem” for presence-only data in ecology. Ann. Appl. Stat. 4 (2010), no. 3, 1383–1402. doi:10.1214/10-AOAS331. http://projecteuclid.org/euclid.aoas/1287409378.

“Pseudo-absences” is commonly used by ecologists to model species distribution so that researchers can apply traditional presence/absence regression methods. However, there are three main weaknesses of this approach. which are related to model specification, interpretation, and implementation. Warton and Shepherd proposed point process models as an appropriate tool for species distribution modeling of presence-only data, given that presence data are actually a set of locations. Assuming locations of point events are independent, the intensity at point is modeled as a function of explanatory variables. They also linked point process model to logistic regression approach, showing that when logistic regression model is applied with an increasing number of pseudo-absences, slope parameters will converge to the point process slope estimates. As an illustration, they constructed Poisson point process models for the intensity of Angophora constata records as a function of a set of explanatory data. They have summarized how point process model can address the three weakness shown by logistic regression approach:
Specification – Point process is a plausible model for the data generation mechanism for presence-only data, while logistic regression is coercing the data to fit the model rather than choosing a model that fits the original data.
Interpretation – the intensity at a point has a natural interpretation as the expected number of presence per unit area, which is not sensitive to choice of quadeature points.
Implementation – PPM offers a framework for choosing pseudo-absences, which is not available for logistic regression.
The point process model introduced by this paper directly addressed some key concerns that are currently raised by “pseudo-absence” approaches for species distribution modeling. Though the dependency of points, as the basic assumption by point process models, may result in some lack of fit for specific set of data, it can be addressed by modeling spatial clustering to fit spatial dependency. It would be great to see some example employing point process models with systematic consideration of sample bias, point independency analysis, modeling fitting, and model diagnose.

MaxEnt versus MaxLike: empirical comparisons with ant species distributions

Screen Shot 2016-03-16 at 11.29.42 AM
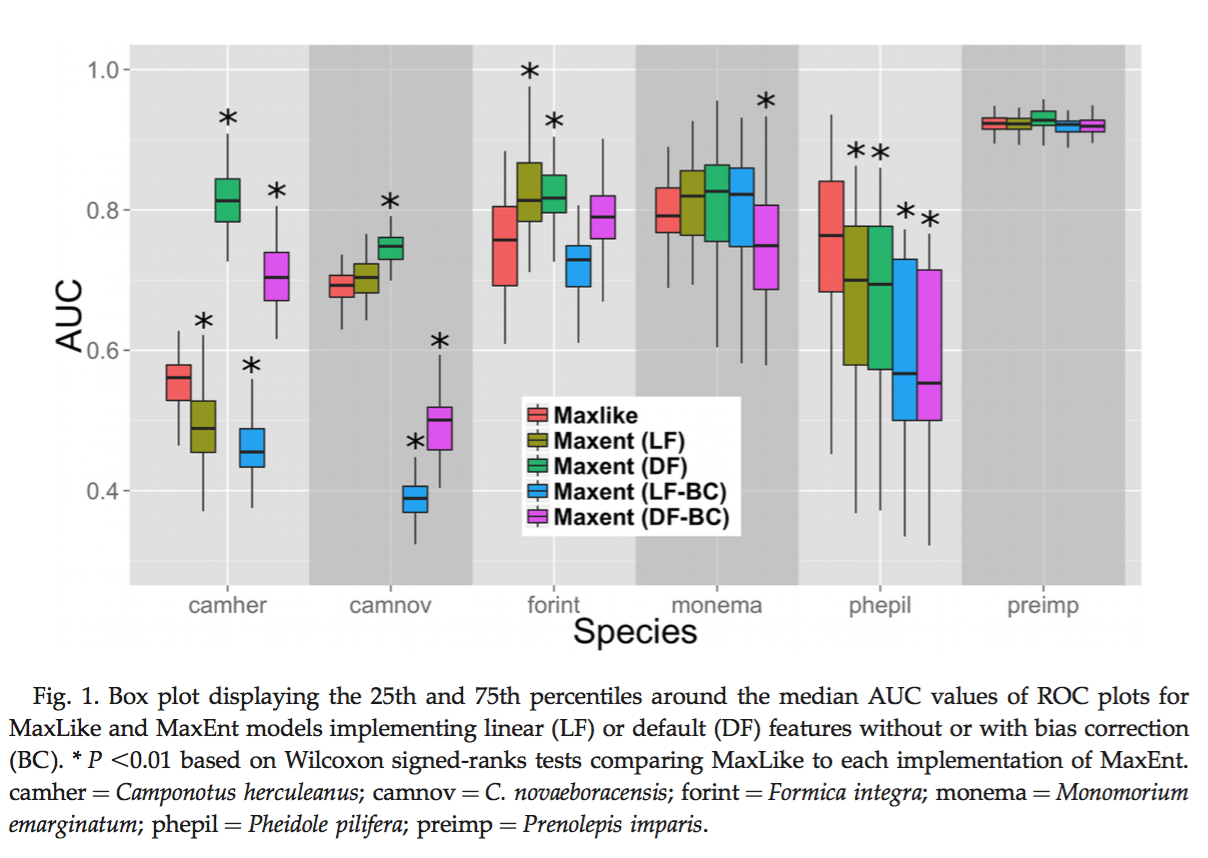
Fitzpatrick, M. C., N. J. Gotelli, and A. M. Ellison. 2013. MaxEnt versus MaxLike: empirical comparisons with ant species distributions. Ecosphere 4(5):55. http://dx.doi.org/10.1890/ES13-00066.1
MaxEnt is one of the most widely used tools for species distribution modeling using presence-background data. Despite its popularity, the exponential model implemented by MaxEnt does not directly estimate occurrence probability but an index of relative habitat suitability. Royle et al suggested the logistic output of MaxEnt may differ substantially from underlying occurrence probabilities. MaxLike is a relatively new maximum-likelihood estimators for the probability of occurrence using presence-only data. Fitzpatrick et al compared the performance and relative merites of MaxEnt and MaxLike using occurrence records for six species of ants in New England. They evaluated model outputs in terms of their statistical fit to the traning data (AIC), their spatial predictions of occurrence relative to testing data (minimum predicted area and AUC), and their professional judgment. Though MaxEnt accounts for sampling bias and include greater model complexity, their results showed that MaxLike exceeds MaxEnt with relatively few occurrence data and limited spatial range coverage. They therefore suggested using MaxLike as alternative to the wildly-used MaxEnt framework. I think it is necessary to remain critical towards wildly-used modeling methods and think about alternatives. It would be interesting to test these two methods based on species other than ants. Since MaxLike is a relative new method, the robustness of it remains to be tested by more implications, while MaxEnt has already been used in a variety of species.

The Crucial role of the accessible area in ecological niche modeling and species distribution modeling

Barve, Narayani, et al. “The crucial role of the accessible area in ecological niche modeling and species distribution modeling.” Ecological Modelling 222.11 (2011): 1810-1819.

doi:10.1016/j.ecolmodel.2011.02.011

Conceptual biases remain little explored in broad-scale ecological niche modeling and species distribution modeling. Species can respond environment in diversy ways: ecological niches may evolve or remain conserved. According to the conceptions in the BAM diagram (Fig 1), the region where species can be found is the intersection of A (environmental factors with values not dependent on species population dynamics, B (sets of variables that are dependent on species population), and M (regions that are accessible by the species but are unrelated with A). Region M depends on opportunities for and constraints on movements of species and is often not included in modeling efforts. Barve et. al. examined the conceptual and empirical reasons behind the choice of study area extent and presented 3 approaches for M estimation: 1. Biotic regions. Regions within which a species is known to occur; 2. Niche-model-based regions. The reconstructed historical distributions of species from models based on their current ecological niche characteristics; and 3. Full dynamic dispersal model, which takes into consideration exolicitly the spatially path-dependent nature of effects of environmental change. They asserted that the accessible area over relevant time periods are the most appropriate for model development, testing, and comparison. Although Barye et. al. emphasized on estimating the set of areas that species were sampled for niche modeling, this idea also has implications for biogeography, macrogeography, and phylogeography.Screen Shot 2016-03-02 at 12.21.23 PM

Support vector machines to map rare and endangered native plants in Pacific islands forests

Pouteau, Robin, et al. “Support vector machines to map rare and endangered native plants in Pacific islands forests.” Ecological Informatics 9 (2012): 37-46.
doi:10.1016/j.ecoinf.2012.03.003

Occurrence records are scarce for rare species, which results in small training sample available for species distribution models. Support Vector Machine (SVM) was traditionally used in remotely sensed data classification for classifying object reflectance, which is substantially the same than classifiers used in species distribution models. Since the decision made by SVM is solely based on few meaningful pixels, this method is much appropriate for predicting distribution of species with scarce occurrence records. Pouteau et. al. compared two machine-learning methods, random forest (RF) and SVM, to determine which method is the most relevant to map rare species and to predict potential habitat with their current observed range. The comparison was performed using three rare plants found at the island of Moorea. Biophysical variables including elevation, climate, geology, soil substrate, disturbance regime, floristic region, plant dispersal capacities, and ecological plant type and function. Their results showed that SVM preformed constantly better than RF in distribution prediction in terms of Kappa coefficient and the area under the curve (AUC). In this case, the predicted distribution generated from SVM has high enough accuracy with only 13 training pixels. This was contributed by the ability of SVM to train model with few meaningful pixels and fit limitation information and the ability to resist noise from insignificant pixels. By comparing species potential habitat with current observed range, we will be able to better understand the causes of the conservation status of the targeted species. So far, there are only limited applications of SVM for special distribution models. It would be interesting to repeat the application for other rare plants or animals.

Capture

Discrimination capacity in species distribution models depends on the representativeness of the environmental domain

Jiménez‐Valverde, Alberto, et al. “Discrimination capacity in species distribution models depends on the representativeness of the environmental domain.” Global Ecology and Biogeography 22.4 (2013): 508-516. DOI: 10.1111/geb.12007

Discrimination capacity, or the effectiveness of the classifier as was discussed in class, is usually the only characteristic that is assessed in the evaluation of the performance of predictive models. In SDM, AUC is widely adopted as a measurement for discrimination capacity, and what is important for AUC is the ranking of the output value, but not their absolute difference. However, calibration or how well the estimate probability of presence represents the observed proportion of presences is another aspect of the performance of model evaluation.

Jiménez‐Valverde et. al. thus examined how changes in the distribution of probability of occurrences make discrimination capacity is a context-dependent characteristic. Through simulation, they found that a well-calibrated model, where the probability of randomly chosen positives have higher S then randomly chosen negatives (P) is equal to S, will not attain high AUC value, which is 0.83. and confirmed that discrimination depends on the distribution of the probabilities. Figure 2 shows some extreme cases demonstrating trade-offs between discrimination capacity and calibration reliability. When a model is well calibrated, dots should line up along the solid line.

Screen Shot 2016-02-17 at 12.05.25 PM

This paper not only well explained the difference between discrimination and calibration and why the increase of one compromises another, it also pointed out two implications in the field of SDM: first, it explains the devilish effect of the geographic extent, which is the reason for the negative relation between the relative occurrence area and discrimination capacity; second, discrimination may not be used to compare different modeling techniques for the same data population and to generalize conclusions beyond that population. It is noteworthy to aware limitations and conditions when evaluating our own models. One practical way is to not report AUC alone, but also be accompanied with information about the distribution of scoring system and, if possible, the model calibration plots.