
DOI: 10.1111/j.1466-8238.2006.00262.x
The spatial scale on which species distribution modeling is undertaken is of fundamental importance for ecological studies. The current paradigm indicates climate governs species distribution on broad biogeographical scales whereas land cover and habitat suitability affect species occupancy patterns, especially at fine resolution. With this context, Luoto et. al. tested whether the integration of land cover data affect bioclimatic models by constructing Generalized additive models for 80 bird species as a function of (1) pure climate and (2) climate and land cover variables. Models were constructed at 10km, 20km, 40km, and 80km resolutions. They evaluated their models using area under the curve (AUC), and found that model performance generally increased when land cover was included at 10km and 20km. In contrast, the inclusion of land cover decreased model AUC at 80km resolution. Therefore, they concluded that the determinants of bird species distributions are hierarchically structured, and that integrating land cover at 10km-20km resolution can improve our understanding of biogeographical patterns of birds in their study area. This paper examined effects of spatial resolution over a range of scales. However, whether a certain spatial resolution is fine or course is species-dependent and question-driven. It would be interesting to discuss about a protocol that help determine appropriate spatial scale for general species distribution modeling.
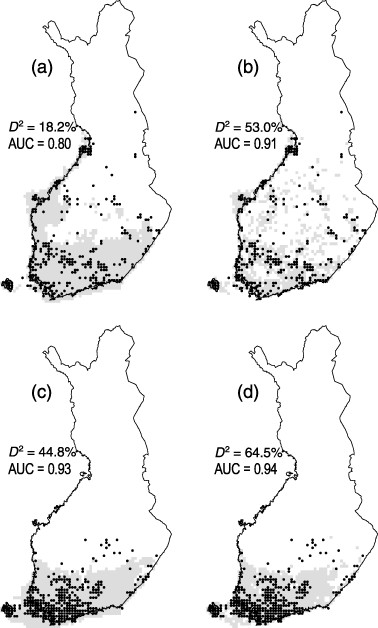
Projected distributions of two species with different modelling accuracies and habitat preferences: the occurrence of marsh harrier (Circus aeruginosus): (a) climate model and (b) climate-land cover model; and the occurrence of grey-headed woodpecker (Picus canus): (c) climate model and (d) climate-land cover model. Black dots represent the sampling plots where the species was present, and shaded areas are the areas modelled as suitable for the species. To determine the probability thresholds at which the predicted values for species occupancy are optimally classified as absence or presence values, we used prevalence of the species as the probability level as suggested by Liu et al. (2005). D2 = percentage of explained deviance and AUC = the area under the curve of a receiver operating characteristic (ROC) plot.