Novel methods for the design and evaluation of marine protected areas in offshore waters

Leathwick, J., Moilanen, A., Francis, M., Elith, J., Taylor, P., Julian, K., Hastie, T. and Duffy, C. (2008), Novel methods for the design and evaluation of marine protected areas in offshore waters. Conservation Letters, 1: 91–102. doi: 10.1111/j.1755-263X.2008.00012.x


Marine protect areas (MPAs) are essential to buffer marine populations from human impact. While there is consensus for a global network of MPAs, they only currently protect 0.6% of the oceans. A major hurdle is determining areas that maximize conservation benefits while minimize economic loss of fisheries (due to excessive reserve size). This paper provides an analytical guide to finding this balance while incorporating:

(1) realistic interpolation of species distributions based on biological and environmental data; (2) ability to handle relatively fine-scale data over large geographic areas; (3) obviation of the need for prior definition of planning units; and (4) identification of a nested set of reserve solutions that comprehensively describe trade-offs between conservation benefits and reserve extent.

The authors applied this guide to the waters off the coast of New Zealand; by law 10% must be MPAs. 96 bottom dwelling fish species’ distributions were predicted by a boosted regression tree using catch data from 21,000 research trawls. Environmental predictors were chosen based on functional relevance, including: trawl depth, temperature, salinity, primary productivity, and zone of ocean mixing/currents.    The BRT was built using 17,000 trawls, and validating on the remaining. Given that the data was zero-skewed (many absences)2 BRT models for each species were built- the first predicted the probability of catch from presence absence, while the second was fit to trawls where that species was occurred. Both models were evaluated with AUC.  These models were then used to make environmental – based predictions for the catch per unit effort for each species for the 1.59 million grid 1 x 1 km surrounding New Zealand.  These predictions were based on fixed trawl parameters. The probability and catch predictions were then multiplied together to form one predictive data layer for each species. This layer was then fed into MPA design software.

Depth, temperature, and salinity have the strongest contributions to predicting species distributions. Together they accounted for roughly half of the variation in catch. The distribution BRT models had high predictive ability when assessed using cross validation and in predicting independent trawls (AUC range 0.86 – 0.99).

New trends in species distribution modelling

Zimmermann, N. E., Edwards, T. C., Graham, C. H., Pearman, P. B. and Svenning, J.-C. (2010), New trends in species distribution modelling. Ecography, 33: 985–989. doi: 10.1111/j.1600-0587.2010.06953.x


*Keep in mind this was written in 2010*

From 2000 to 2010, SDMs underwent rapid development; taking advantage of new computational resources. Major areas of improvement include:

  1. implementation of new statistical models
  2. the evaluation of sampling design on performance
  3. sample size and and prevalence impact on accuracy
  4. removal of spatial autocorrelation from model fitting
  5. comparison of a range of statistical methods
  6. model evaluation

More recent studies have shifted focus to clarification of the niche concept, model parameterization schemes, model selection, model evaluation and variable selection methods.

The papers focus on five active areas of research involving SDMs, including: 1) historical legacies; 2) niche stability and evolution; 3) biotic interactions; 4) the importance of sample designs; and 5) species invasions. We believe these papers set the stage for future SDM research questions, and represent several next logical steps in SDM research and application.

1) Legacy of history: The effect of history on range size and distribution patterns is generally not considered, in other words, the assumption of range equilibrium. However, violating this assumption can lead to incorrect conclusions.

2) Niche stability and evolution: Niche stability can be thought of as a measure of phylogenetic conservation. Stable niches of closely related species will have similar environmental constraints, while differences can be attributed to local adaptation.  SDMs can be used in this area by examining niche response to environmental drivers at a sub-species level.

3) Biotic interactions: Commonly, biotic interactions are ignored when modeling species ranges in large spatial scales. However, inclusion of biotic factors have increase model performance given an environmental disturbance.

4)Design for sampling: Available datasets are highly biased due to the haphazard sampling nature. Exploring the impact of different biased sampling in silico or controlled surveys, will guide future SDM sampling bias corrections.

5) Species invasion: SDM are often used to assess invasion risk. However, the equilibrium assumption in the native range or novel favorable habitat in the foreign range may lead to an underestimation.  Developing methods to overcome these limitations will greatly improve SDM accuracy with respect to invasions.


Static species distribution models in dynamically changing systems: how good can predictions really be?

Zurell, D., Jeltsch, F., Dormann, C. F. and Schröder, B. (2009), Static species distribution models in dynamically changing systems: how good can predictions really be?. Ecography, 32: 733–744. doi: 10.1111/j.1600-0587.2009.05810.x


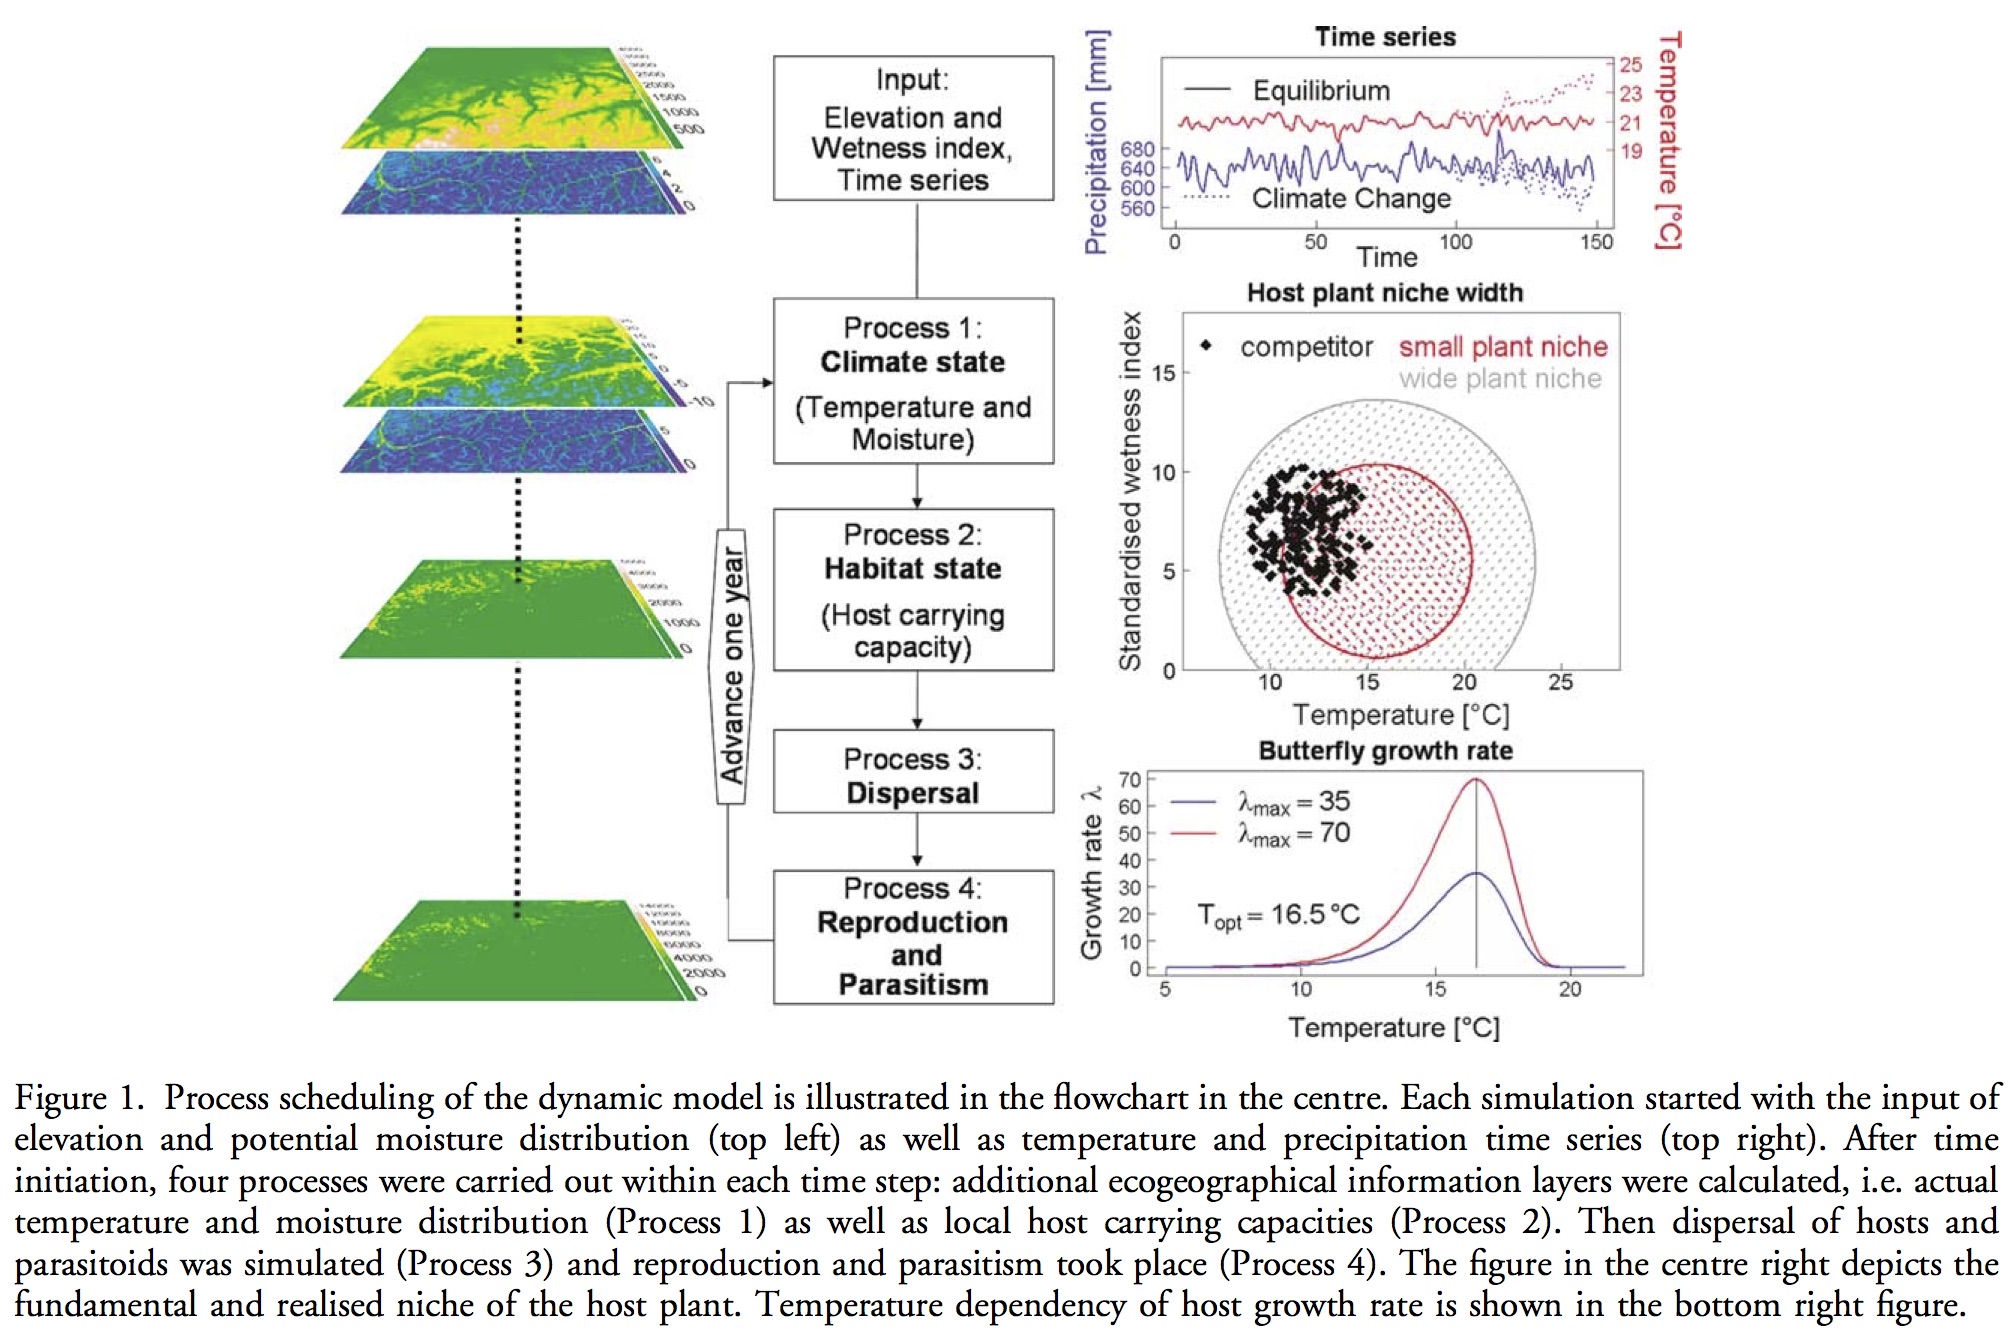
SDMs are often used to predict changes in species’ distribution under climate change. However, these models implicitly assume equilibrium, and do not incorporate dispersal, demographic processes or biotic interactions explicitly. In order to understand the implications of such assumptions, the authors created a spatially explicit multi-species model. The 2 dimensional lattice of 148 X 113 sites with absorbing boundaries. The system was populated with butterflies and parasitoids that were able to leave, but not return. Climate which influenced habitat was assigned to each site, and changed with time. Simulations were 150 years. Occurrence data, collected by a ‘virtual ecologist’, was fit to a GLM and boosted regression tree.

Zurell_Fig1

Under average climate, GLMs and BRT had high predictive accuracy.  Abrupt range shifts caused a loss in predictive power, but was regained after a small lag period settling at a new equilibrium.  Generally, BRT out preformed GLMs under range expansion, and long-dispersal (vs short dispersal) organisms were tracked better.

Application of bioclimatic models coupled with network analysis for risk assessment of the killer shrimp, Dikerogammarus villosus, in Great Britain

Gallardo et al. Application of bioclimatic models coupled with network analysis for risk assessment of the killer shrimp, Dikerogammarus villosus, in Great Britain. Biol Invasions (2012) 14:1265–1278 DOI 10.1007/s10530-011-0154-0


Freshwater systems are particularly prone to invasive species. Propagules lead to established populations when the invaded system matches the species’ ecological requirements. The environmental match between native and foreign systems are commonly modeled using SDM, which climate as the main driver.  Dispersal of established species are limited by hydrological connectivity; this can be modeled as a network.  The authors combine these two approaches to model the potential spread of killer shrimp in Great Britain, which is currently established in 3 confined locations.

First, areas in Great Britain of climatic similarity to the native range were identified. These areas are considered high risk. A total of 248 European occurrences and a set of 6 bioclimatic factors were used to build a 2 class support vector machine. The data set was split 80/20 into training/testing. Pseudo-absences were drawn from a European-wide background, and used to evaluate the model via AUC. The minimum training presence was also reported. The SVM model was projected onto Europe, where probabilities could be derived via Platt’s (ie. fit a logistic regression model to the estimated decision values). Models were converted to binary outcomes based on the threshold that maximized specificity and sensitivity. Hydrological networks were used to model 3 different speeds of dispersal: high (100km/yr) medium (60km/yr) and low (20km/yr). Areas that would be colonnaded within 5 years were considered highest risk.

SVM had a high accuracy score (AUC=0.97), in the minimum training presents was relatively low (11%).  Based on the model, habitat suitability was greatest altitude below 500 m, maximum temperature between 20 and 30°C, minimum temperature between -5 and 5°C and annual precipitation lower than 1000 mm. Unfortunately, 44% of Great Britain showed climate suitability higher than 50%. Regardless of speed, the network analysis indicated the north east part of the study site is at high risk of being invaded in the next 5 year. Areas of highest suitability within Great Britain already support a well-established and abundant population of a Ponto-Caspian species (zebra mussel).

Tackling intraspecific genetic structure in distribution models better reflects species geographical range

Marcer, A., Mendez-Vigo, B., Alonso-Blanco, C., & Pico, F. X. (2016). Tackling intraspecific genetic structure in distribution models better reflects species geographical range. Ecology and Evolution, 6(7), 2084-2097.

DOI: 10.1002/ece3.2010

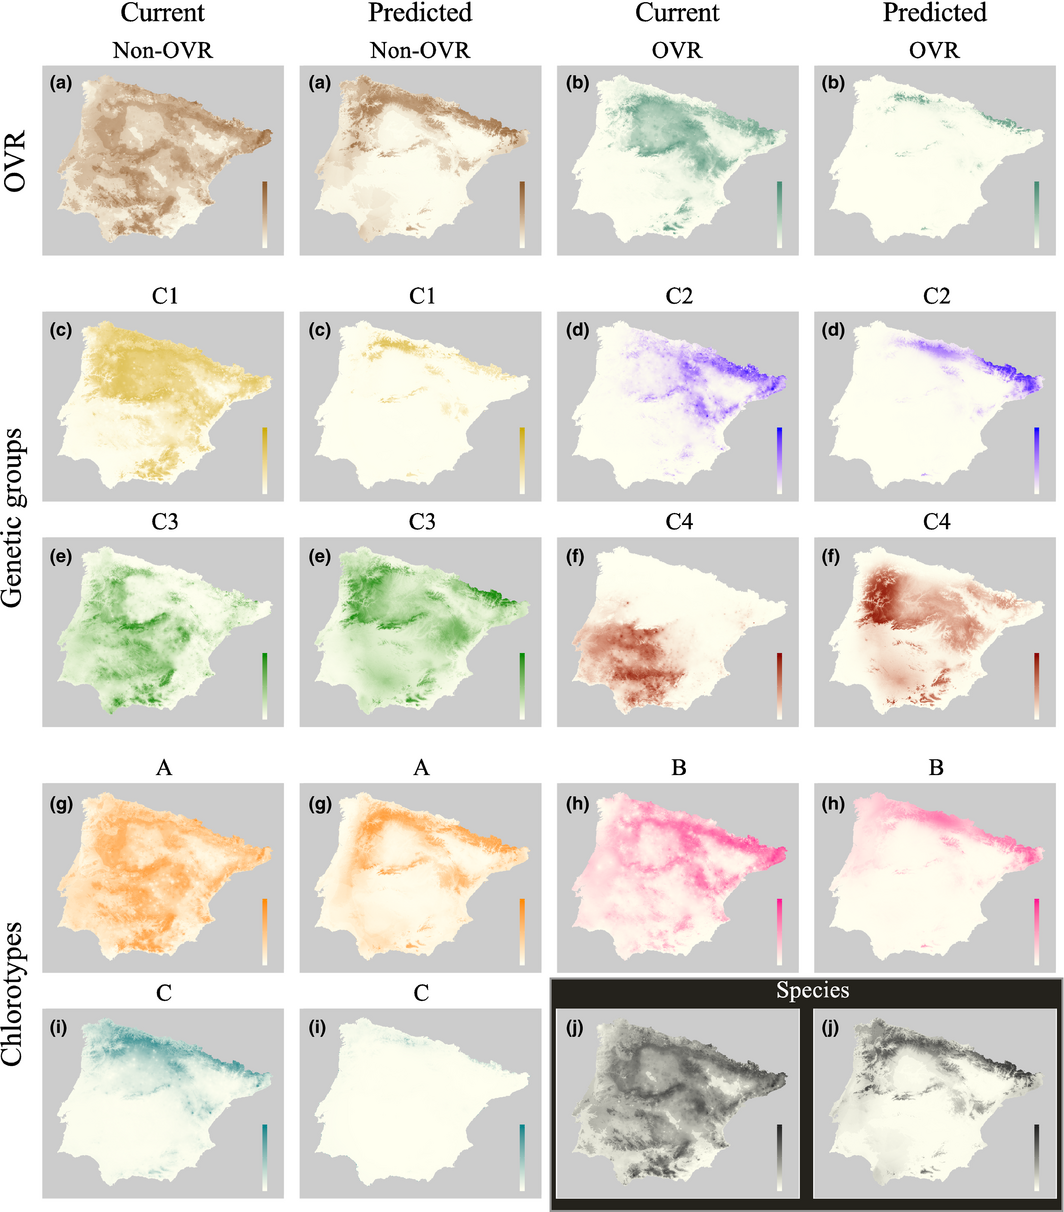
ece32010-fig-0003

Classical taxonomic designations may not represent the ecological or evolutionary unity that matter to understand the mechanisms that shape biogeographic patterns. Interspecific genetic variation can influence how a species responds to it changes in its environment. This may make genetic variation important in understanding how species distributions will respond to climate change. Work in the Iberian Peninsula has demonstrated that genetic variation in A. thaliana is geographically structured due to the locations of ice age refuges. This study combines SDM with genetic analyses of the plant to determine how SDMs predict the current distribution of A. thaliana genetic units and which environmental variables account for the genetic variation. The species was split into four genetic clusters on the Iberian Peninsula. A MaxEnt model was constructed using three environmental data sources and 279 presence records which correspond to the genetic samples.  The distribution of the species was mainly explained by pH and agricultural land, with the species more likely to occur in acidic conditions. When the model is broken down by cluster variable importance changes from model to model. This highlights the importance of incorporating genetic variation into the predictive model. These units vary in which variables are most important in determining habitat suitability and as the environment changes the species may be influenced in different way throughout its range. By separating the species into distinct genetic units we may be able to understand fluctuations in species distribution better as climates change.

Remotely sensed temperature and precipitation data improve species distribution modelling in the tropics

Deblauwe, V., Droissart, V., Bose, R., Sonke, B., Blach-Overgaard, A., Svenning, J. C., et al. (2016). Remotely sensed temperature and precipitation data improve species distribution modelling in the tropics. Global Ecology and Biogeography, 25(4), 443-454.

DOI: 10.1111/geb.12426


Species distribution models are becoming increasingly popular in many fields of biology. To improve model generality, SDMs are usually built using climatic variables, particularly those from widely available resources like the WorldClim database. These widespread remote sensing databases can be useful in areas that are sparse in station collected data. This study compares SDMs built using WorldClim and CRU data and three publically available remote-sensing derived datasets. The authors examine two aspects of model quality (the models ability to express association between climate and species distribution and model transferability). Models were constructed for 451 species in the tropics using either WorldClim and CRU or using remotely sensed data. Two modeling approaches were used to assess the difference between data sources (MaxEnt and GLM). For WorldClim based models training AUC scores were above 0.7, but AUC scores were only significantly higher than simulated distributions with AUC of 0.5 in 40% of models. When replacing WorldClim data with the remote sensing data AUC values increased and the number of models significantly higher that simulated distributions increased as well. MaxEnt models performed better than GLMs when transferred to a new dataset. Incorporating remote sensing data into the model did not improve transferability over models based on WorldClim data. Modeling species distributions in regions with limited weather stations is difficult. This can be problematic in areas like the tropics where large regions of forest may have very few stations. The inclusion of remotely sensed data can provide coverage to these areas. In general the inclusion of remote sensing data improved the model over just using WorldClim, though in some cases transferability decreased. This suggests that the inclusion of both data types may be the best option to improve accuracy and maintain transferability. This study highlights the applications of remotely sensed climate data, especially in regions where data from weather stations is scarce.


Data prevalence matters when assessing species’ responses using data-driven species distribution models.

Fukuda, S., & De Baets, B. (2016). Data prevalence matters when assessing species’ responses using data-driven species distribution models. Ecological Informatics, 32, 69-78.

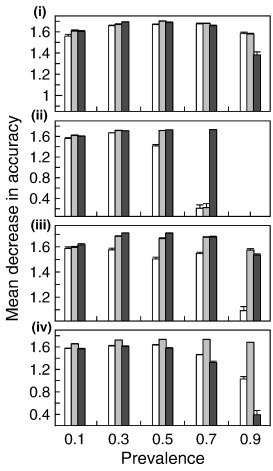
DOI: 10.1016/j.ecoinf.2016.01.0051-s2.0-S1574954116000200-gr6

It is widely known that data quality and quantity can influence model accuracy. Studies have also concluded that data prevalence can have an effect on model accuracy, though no studies have examined how data prevalence may influence the habitat suitability inferences drawn from the model. This study looks at how data prevalence affects model accuracy and habitat information retrieved for the SDM using virtual species with varying prevalence. Virtual species were generated from three habitat variables and hypothetical habitat suitability. Data sets were simulated for each species with prevalence of 0.1, 0.3, 0.5, 0.7, and 0.9. Three species distribution models were built for each data set. Model accuracies varied between model type with random forest performing the best, followed by SVM, and then FHSM. Model accuracy responded differently to prevalence between each model type. The error for FHSM models increased as prevalence increased. For random forests the error was influenced more by the data sets than the prevalence. SVM model error exhibited no trend with varying prevalence. Variable importance differed across dataset and prevalence. In general the data models overestimated habitat suitability except for in the case of prevalence equal to 0.1. This study demonstrated the effects of data prevalence on model accuracy. Dependence of model accuracy on data prevalence varied by model. These results may demonstrate a level of robustness of these models to varying data prevalence. When considering which model to use for a species distribution data prevalence may be an important factor to consider as depending on the model uses prevalence can influence the accuracy of the model and the inferences a researcher may draw.  

Community dynamics under environmental change: How can next generation mechanistic models improve projections of species distributions?

Singer, A., Johst, K., Banitz, T., Fowler, M. S., Groeneveld, J., Gutierrez, A. G., et al. (2016). Community dynamics under environmental change: How can next generation mechanistic models improve projections of species distributions? Ecological Modelling, 326, 63-74.

DOI: 10.1016/j.ecolmodel.2015.11.007

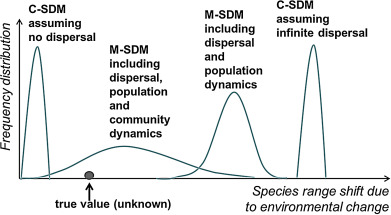
1-s2.0-S0304380015005281-gr3

In order to sustain biodiversity and ecosystem services we need predictive models that can reliably project the consequences of climate change and anthropogenic impacts on ecological communities. Currently several approaches exist to predict the impact of climate change on species. Correlative species distribution models relate observations of a species to the local environment and then predict how that distribution may be influenced by a changing environment. Mechanistic or process based models describe biotic and abiotic factors that mechanistically describe the individual and its response to climate change. Due to their structural difference correlative and mechanistic models are well suited to tackle different problems in species distribution modeling. This paper gives an overview of how biotic processes influence species distribution and how these processes alter the projections made by the model. The inclusion of biotic process has three consequences on modeling, (1) an increases in structural realism reflecting the mechanistic knowledge of the system improves model accuracy, (2) insufficient ecological knowledge about the process may increase parameter and structural uncertainty, (3) the additional complexity by incorporating the biotic process may increase uncertainty further. While incorporating relevant biotic processes are likely necessary to achieve the most accurate projects theoretically, if these processes are not adequately informed the added uncertainty could reduce accuracy and make model projections unreliable.  In order to generate models that can reliably project into the future the authors present a protocol for incorporating data into a distribution model. First all relevant knowledge that could inform the projections of current and future species distributions. Next, parameterize all the relevant processes, and attempt to assess the consequences of uncertainty these parameter on you model projections. Next use an iterative loop to identify knowledge gaps and improve the models accuracy. Finally, they recommend communicating the evaluation and interpretation thoroughly to aid in advancement of mechanistic based approaches for large scale species distribution modeling. While mechanistic models may prove to be more accurate in some cases, often we find that the data or knowledge to build these models is insufficient. Correlative models are likely still sufficient particularly in cases where the only data available is presence locations with limited knowledge on the processes that influence the species.

What do we gain from simplicity versus complexity in species distribution models?

Merow, C., Smith, M. J., Edwards, T. C., Guisan, A., McMahon, S. M., Normand, S., Thuiller, W., Wüest, R. O., Zimmermann, N. E. and Elith, J. (2014), What do we gain from simplicity versus complexity in species distribution models?. Ecography, 37: 1267–1281. doi: 10.1111/ecog.00845


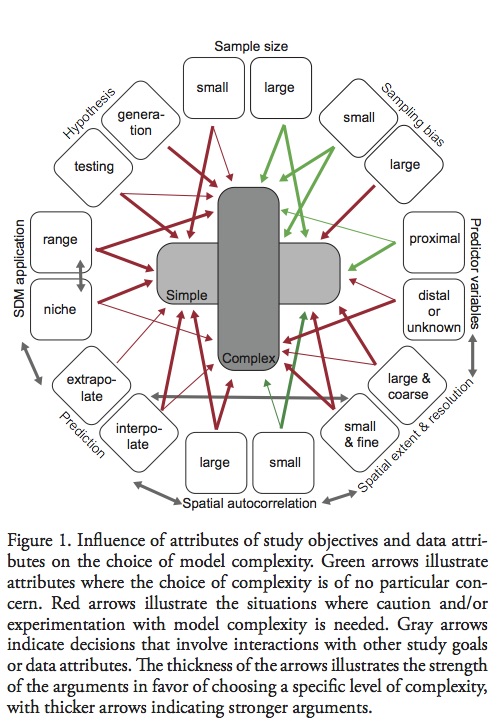
The variety of methods and implementations of SDMs allow for a wide range of complexity, however it is critical to match study objectives and complexity for robust inference.   On one hand, “under fit” models insufficiently describe observed occurrence – environment relationships, risking misunderstanding the factor shaping species distributions. On the other hand, “over fit” models risk inadvertently ascribing pattern to noise or building opaque models. Finding the balance between over and under fit models must be constrained by the attributes of data and study objective rather than traditional model selection.   The authors characterize model complexity by the shape of the inferred occurrence – environment relationships, see table 1. This paper develops guidelines for deciding the appropriate level of model complexity as outlined in Fig 1.

wk5_fig

Ecologist’s preference for simple or complex models are often influenced by their past experience with data types and questions- rather than philosophical approach.

Testing projected wild bee distributions in agricultural habitats: predictive power depends on species traits and habitat type

Marshall et al. Testing projected wild bee distributions in agricultural habitats: predictive power depends on species traits and habitat type. Ecology and Evolution 2015; 5(19): 44264436. DOI: 10.1002/ece3.1579


Pollinators are ecologically and economically important, but have been in decline. Some conservation initiatives have been implemented, but the effectiveness depends on the characteristics of the surrounding landscape and other environmental variables. Creating species distribution models (SDM) for wild bees can be challenging given their high mobility. Additionally, SDMs the often data aggregated over number of years and are rarely validated with external data. Authors examine the performance of SDMs in correctly predicting wild bee occurrences from field surveys. Furthermore, they attempt to identify species and/or traits that are better suited to SDMs.

They expect species with highly specialized habitat needs or rare species to have higher predicted habitat suitability by the SDM. Additionally, the authors expect better performance in agriculture areas that are stable such as orchards rather than agriculture subject to crop rotation.

The distribution of wild bees in the Netherlands was modeled using a total of 43,989 observations including for 193 species across 25 genera. Records dated back to as early as 1990. The MAXENT model included 13 variables: seven land use, five climate and elevation. Background points were sampled from areas where wild bee species had been found since 1990. AUC values recalculated from a 10 fold cross validation scheme, in the final model was validated with independent field surveys from agricultural sites.  

 The performance of SDM to predict wild bee occurrences in field surveys depended on species trait, target habitat, and sampling technique. Generally, the model performed better for highly specialized species with restricted habitats. This is promising, given that most species identified for conservation purposes are often specialists.  M onany species were found in predicted unsuitable habitats, but this is most likely due to the seasonal changes in crop flowering or crop rotation that is not captured in the SDM.  This study demonstrates the need to incorporate more specific information about landscape type, crop type, including fine-scale vegetation and information on flower availability by seasons into SDMs used for conservation purposes.