Biotic interactions boost spatial models of species richness

Mod, H. K., et al. (2015). “Biotic interactions boost spatial models of species richness.” Ecography 38(9): 913-921.

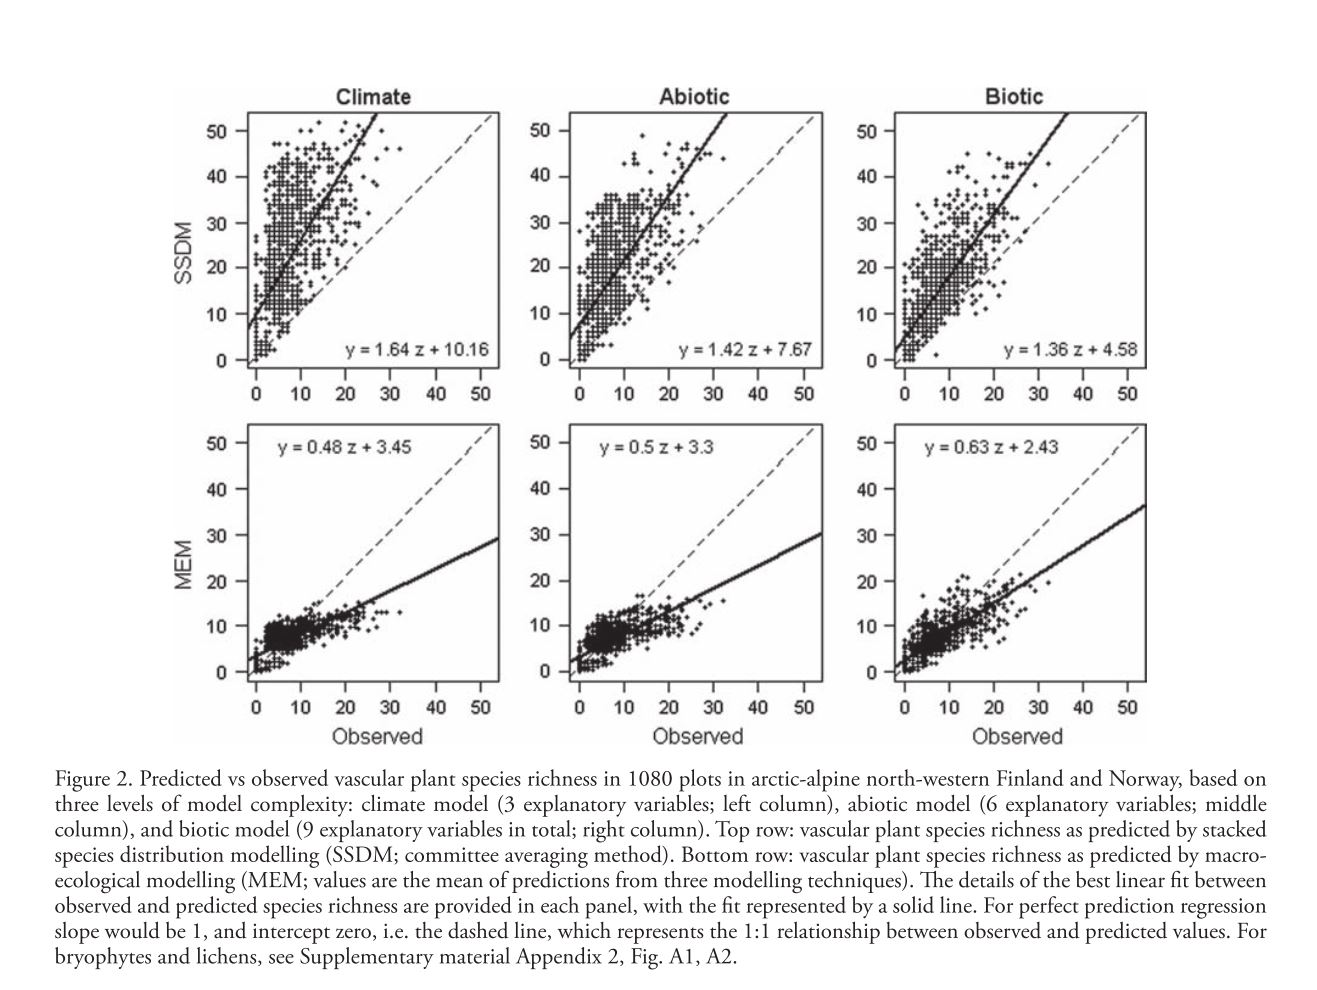
Mod et al. attempt to address the general lack of quantitative consideration of biotic interactions in spatial modeling. Rather than basic spatial distribution modeling they model species richness across a landscape with two different methods. The first, somewhat familiar, method is stacked species distribution (SSDM) in which species distribution models are fitted for all species and then overlaid to determine species richness at each point. These models are fit using Generalized Linear Models (GLMs), Generalized Additive Models (GAMs), and Generalized Boosted Models (GBMs) and SSDMs are generally expected to overpredict species richness because the simple stacking implies no intrinsic environmental carrying capacity. They also use macroecological models (MEM) which directly model species richness and implicitly consider the environment to be limiting to the number of species. MEMs do not make any distinction between different species and generally tend to overpredict richness in species-poor sites while underpredicting richness in species rich-sites. In order to ascertain the ability of biotic variables to improve prediction and potentially correct these problems the authors build 3 different types of models and fit them to 3 taxonomic groups (vascular plants, bryophytes, and lichens). The first (Climate) model includes mean air temperature of the coldest quarter, growing degree days, and ratio of precipitation to evaporation, all broad-scale environmental drivers known to have a strong impact on vegetation. The second (Abiotic) model includes the Climate model as well as soil quality, soil wetness, and solar radiation as finer scale abiotic predictors. Finally the third (Biotic) model includes all previous predictors and the cover of three dominant species known to have impacts on the distribution of other species. These three species show both competition and facilitation based effects on a number of different species. In order to determine the fit of different models a linear regression was fitted to the plot of predicted vs. observed species richness (slope = 1 and intercept=0 represents perfect prediction). The inclusion of biotic variables increased fit and decreased bias for both methods across all taxa, the regression slope and intercept more closely approaching the ideal values. Mean AUC values averaged across all species models built for SSDM were higher as well. The fact that inclusion of biotic variables significantly improved fit across two different modeling methods strongly supports the extra explanatory/predictive power this data can offer. The widespread application of these methods relies, however, on the accurate determination of important biotic variables. This study was able to approximate competition pressure using the cover of 3 dominant species, an assumption which may be generalizable to a number of shade/nutrient limited plant systems. Systems with a more diverse and “evenly distributed” competition landscape may be very difficult to model in this way because knowledge of many species’ distributions across the landscape may be necessary to build these models.mod et al. figure

The fundamental and realized niche of the Monterey Pine aphid, Essigella californica (Essig)(Hemiptera: Aphididae): implications for managing softwood plantations in Australia

Wharton, Trudi N., and Darren J. Kriticos. “The fundamental and realized niche of the Monterey Pine aphid, Essigella californica (Essig)(Hemiptera: Aphididae): implications for managing softwood plantations in Australia.” Diversity and Distributions 10.4 (2004): 253-262.

Wharton and Kriticos build two predictive models of the global distribution of the Monterey pine aphid Essigella californica. E. californica is native to western North America, from Southern Canada to Northern Mexico but has recently expanded to Europe, South America, Australia, and, notably, one record in southern Florida. Unlike in its native range E. californica poses a substantial threat to expanding pine timber plantations in Australia. The authors used a CLIMEX model, which can be fit using either lab based measures of temperature and moisture based growth/stress or inference of these parameters based on known distributions. CLIMEX considers both the potential for population growth under favorable conditions and the probability of population survival under climatic temperature and moisture based climatic stressors. Models were initially fit to the North American distribution of E. californica, using the CLIMEX model of the Russian wheat aphid, Diuraphis noxia, as a template, and validated using the Australian distribution. A first model (I) was fit without the potentially anomalous point in Florida and a second (II) was fit including this point. Stress indices range from 0 (no stress) to 100 (lethal conditions) while growth indices range from 0 (no growth) to 100 (optimal growth conditions throughout the year). Stress effects are based on cold stress, heat stress, dry stress and hot-wet stress, with stress accumulating weekly based on threshold values. The model (I) excepting the Florida point relatively accurately predicts the North American distribution while failing to predict E californica’s ability to persist north of the News South Wales/Queensland Border in Australia due to a limit imposed by hot-wet stress. Model (II) fit using the single Florida presence point far more accurately predicts distribution in Australia while substantially overpredicting distributions across the Midwestern, Eastern, and Southeastern United States. The authors come to the conclusion that the known distribution of E. californica most closely resembles the predictions of model (II). They suggest that biotic factors, including limited pine diversity and competition with other Essigella species, are likely preventing the spread of E. californica eastward to the areas predicted by model (II). Most pine plantations occur in regions within the potential distributions of this model suggesting high risks of further E. californica expansion and the economic damage that would accompany it. The CLIMEX modeling concept of Stress/Growth Potential may more closely approximate the mechanistic relationship between seasonal climate and population persistence than simple association based models. This analysis suffers, however, from a substantial amount of over-prediction with limited, qualitative explanations and highlights the need to effectively account for biotic interactions in SDMs.Wharton and Kriticos figure

Physiographically sensitive mapping of climatological temperature and precipitation across the conterminous United States

Daly, C., Halbleib, M., Smith, J. I., Gibson, W. P., Doggett, M. K., Taylor, G. H., et al. (2008). Physiographically sensitive mapping of climatological temperature and precipitation across the conterminous United States. International Journal of Climatology, 28(15), 2031–2064. http://doi.org/10.1002/joc.1688

Daly et al. created a 30 arc-sec climate map of the continental United States, mapping mean monthly precipitation, and minimum and maximum temperature, referred to as the PRISM map. Similar to other models, they interpolated point weather station data from 1971-2000 over a grid using a climate-elevation regression. Station data was weighted based on nine PRISM algorithms that incorporated spatial clustering and relevant topographic data, including coastal proximity, temperature inversion potential, and location on topographic slopes. Including data such as this allowed the model to more accurately predict local climatic events such as temperature inversion in valleys and rain shadows. To clean and validate the data, local experts were brought in for each region, in addition to manual exclusion of extreme and data errors. Daly et al. used two measures of uncertainty to evaluate their model, jack-knifed cross-validation and a 70% regression prediction interval. Error was highest in the more physiographically complex areas of the US, as expected, and the two measures performed similarly with increasing area scale. When compared to Daymet and WorldClim, PRISM better predicted temperatures at high elevation, because of its inclusion of the two-layer temperature inversion, while Daymet and WorldClim had a cold bias in these areas. Additionally, the inclusion of regional coastal algorithms for the different coasts of the US led to more accurate depictions of coastal temperatures in California than the other maps. In less complex areas, such as the MidWest, however, all three maps performed similarly. The inclusion of more topographic complexity in PRISM is an improvement over similar climate grids of the US, especially in the Pacific Northwest, but offers little benefit in areas of shallow elevation gradient in the middle of the country. When available, it seems logical and worthwhile, in my opinion, to include this additional complexity, as climate is not solely dependent on elevation and does not incorporate finer scale differences.


Because they do not have temperature inversion along slopes, both Daymet and WorldcClim have a strong cold bias at high elevations.
Because they do not have temperature inversion along the elevation gradient, both Daymet and WorldClim have a strong cold bias at high elevations.

Competitive Interactions between Tree Species in New Zealand’s Old-Growth Indigenous Forests

Leathwick, J. R., & Austin, M. P. (2001). Competitive Interactions between Tree Species in New Zealand’s Old-Growth Indigenous Forests. Ecology, 82(9), 2560–2573. DOI: 10.2307/2679936

A major limitation of current species distribution models is the exclusion of biotic predictors and species interactions in models. It is difficult to separate the spatial patterns of species interactions and environmental covariates in a model because the distribution of non-focal species is itself dependent on environmental covariates. The Nothofagus forests of New Zealand, however, present an ideal natural experiment, because their species distribution is based on historical landscape shifts, not environmental covariates, enabling the inclusion of Nothofagus presence- absence in a model without confounding the abiotic covariates. To examine the contribution of species interactions to SDMs, Leathwick and Austin fit GAMs to New Zealand tree species, including both environmental factors and presence-absence of Nothofagus species, and the interaction between environmental variables and competition. Environmental regressions in the absence of competition were first created for each species. Terms describing Nothofagus density and an interaction between Nothofagus density and temperature were then added to the regression. A reduction in deviance due to the addition of a term was interpreted to mean that the factor did influence the focal species distribution. The addition of competition significantly reduced the deviance for all species, and did so on a larger magnitude than did the environmental covariates, except for mean temperature, suggesting that competition significantly impacts species distributions. Additionally, including competition in the SDMs led to an upwards shift in species’ optimal temperature. The authors validated their model by comparing predictions using environment-only regressions and environment-competition regressions for two data sets. The environment-competition model seemed to predict species distributions more accurately, but this accuracy was not assessed quantitatively. Leathwick and Austin’s results suggest that future SDMs must take into account more realistic species interactions, as in some cases, they influence species distributions WORD at least as much as environmental covariates. However, their reliance on reduced deviance as proof of the role of competition could be improved upon by using a more rigorous, quantitative training method. Further work exploring the interaction between competition and environmental covariates, and that competition potentially alters the thermal niche of species, should be done and would be especially relevant in the face of climate change.

Inclusion of Competition in Models Led to Decreased Density of Focal Species