Effects of sample size on the performance of species distribution models

Wisz, M.S., Hijmans, R.J., Li, J., Peterson, A.T., Graham, C.H. and Guisan, A., 2008. Effects of sample size on the performance of species distribution models. Diversity and Distributions, 14(5), pp.763-773.

http://onlinelibrary.wiley.com/doi/10.1111/j.1472-4642.2008.00482.x/pdf


Wisz et al. set out to address the ways in which limited sample size (which is often a problem when constructing Species Distribution Models) on model performance. The importance of sample size to SDM comes in the fact of the lower uncertainty of parameter estimation with increasing sample size. This importance is compounded by the high dimensionality of the environmental space often being modeled and the fact that the interactions between multiple environmental dimensions are often important. All this serves to increase the total number of parameters to be estimated, placing further demands on sample size. Therefore, the authors chose to test the sensitivity of 12 different species distribution models (see Table 1 in paper for full list) to sample size variation. Models were trained with presence-only data from natural history collections and evaluated with independent presence-absence data from planned surveys, via AUC. All 12 models were trained on 10, 30, and 100 randomly sampled presence points for each species. Each of these training subsets was evaluated for its degree of overlap in environmental space with the evaluation points for that species. Finally, linear mixed effects models were used to determine which factors significantly affect AUC. Smaller sample sizes exhibited significantly lower environmental range overlap than larger samples. LMEs showed a significant effect of the interaction between modeling method and sample size. Nearly all algorithms performed better with more records (exceptions being DOMAIN and LIVES). MaxEnt performed best at low sample sizes and was the second best performer at intermediate and high sample sizes (outperformed by GBM) with intermediate variances at all sizes. BIOCLIM exhibited the lowest variance across all models but also very low AUCs. At 10 records MAXENT, OM-GARP, and DOMAIN all had high AUCs with intermediate variances. As expected, methods that model complex predictor relationships were particularly sensitive to sample size (e.g. GAM, GBM, BRUTO). A major open-ended question of the work is what the difference between randomly subsetted data and “naturally data-depauperate” species records resulting from biological rarity. It stands to reason that the above analyses may not accurately apply to such a situation.


wisz et al.

Potential for spread of the white-nose fungus (Pseudogymnoascus destructans) in the Americas: use of Maxent and NicheA to assure strict model transference

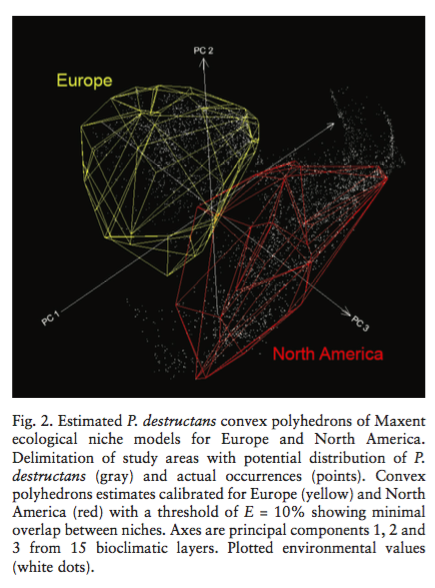
Escobar et al. (2014) model the range of Pseudogymnoascus destructans, the pathogenic fungus that causes white nose syndrome (WNS) in bats, in North America and Europe. They collected 218 observations of WNS for use in Maxent species distribution models. Variables in their model included the usual suspects (temperature, etc) along with some that are more important for modeling bat & fungus distribution (mean temperatures of coldest winters, annual precipitation, etc). Maxent models were then carried out on buffer areas of 500 km around European and North American occurrences. After calibration with Maxent of the training data in the two continents, projections of distributions to South America were generated. Three different approaches for projection were used: one without extrapolation, one with extrapolation, and NICHE-A models. NICHE-A models describe the fundamental niche in environmental space, thus identifying potential geographic places that may fall inside the minimum environmental ellipsoid containing all training points. In order to understand habitat differences in North America and Europe, the authors conducted tests for background similarity. They found that the two areas did not diverge significantly across the two continents, suggesting no real niche differentiation has demonstrably taken place between the two continents. However, depending on the projection approach and training data origin (from N America, Europe, or N America & Europe), Maxent transfer models differed markedly. Their use of NICHE-A, which reminds me of RangeBag, produced similar results to Maxent. I’m not sure I fully buy their results of projection to South America, given the differing community composition of bat species in South America and lack of clear evidence that WNS can infect these differing bat species. Even if these results give rise to error of commission in modeling WNS, I think the study is important because it can point ecologists and conservationists to regions at risk for transmission.


Escobar, L.E. et al., 2014. Potential for spread of the white-nose fungus (Pseudogymnoascus destructans) in the Americas: use of Maxent and NicheA to assure strict model transference. Geospatial Health, 9(1), pp.221–229. link to paperScreen Shot 2016-03-21 at 10.18.50 PM


POISSON POINT PROCESS MODELS SOLVE THE “PSEUDO-ABSENCE PROBLEM” FOR PRESENCE-ONLY DATA IN ECOLOGY

Warton, David I.; Shepherd, Leah C. Poisson point process models solve the “pseudo-absence problem” for presence-only data in ecology. Ann. Appl. Stat. 4 (2010), no. 3, 1383–1402. doi:10.1214/10-AOAS331. http://projecteuclid.org/euclid.aoas/1287409378.

“Pseudo-absences” is commonly used by ecologists to model species distribution so that researchers can apply traditional presence/absence regression methods. However, there are three main weaknesses of this approach. which are related to model specification, interpretation, and implementation. Warton and Shepherd proposed point process models as an appropriate tool for species distribution modeling of presence-only data, given that presence data are actually a set of locations. Assuming locations of point events are independent, the intensity at point is modeled as a function of explanatory variables. They also linked point process model to logistic regression approach, showing that when logistic regression model is applied with an increasing number of pseudo-absences, slope parameters will converge to the point process slope estimates. As an illustration, they constructed Poisson point process models for the intensity of Angophora constata records as a function of a set of explanatory data. They have summarized how point process model can address the three weakness shown by logistic regression approach:
Specification – Point process is a plausible model for the data generation mechanism for presence-only data, while logistic regression is coercing the data to fit the model rather than choosing a model that fits the original data.
Interpretation – the intensity at a point has a natural interpretation as the expected number of presence per unit area, which is not sensitive to choice of quadeature points.
Implementation – PPM offers a framework for choosing pseudo-absences, which is not available for logistic regression.
The point process model introduced by this paper directly addressed some key concerns that are currently raised by “pseudo-absence” approaches for species distribution modeling. Though the dependency of points, as the basic assumption by point process models, may result in some lack of fit for specific set of data, it can be addressed by modeling spatial clustering to fit spatial dependency. It would be great to see some example employing point process models with systematic consideration of sample bias, point independency analysis, modeling fitting, and model diagnose.

Historically calibrated predictions of butterfly species’ range shift using global change as a pseudo-experiment

Kharouba, Heather M., Adam C. Algar, and Jeremy T. Kerr. “Historically calibrated predictions of butterfly species’ range shift using global change as a pseudo-experiment.” Ecology 90.8 (2009): 2213-2222.

DOI: 10.1890/08-1304.1

Case study conducted by Kharouba et. al. used a climate and land use change scenario in Canada for a pseudo experiment to test model reliability for predicting species range shifts over long time periods (30-60 years) and very large geographical areas for 297 butterfly species. They used historical distribution data with six environmental predictor variables over a 10 million km2 range and modeled with MaxEnt. Steps included: generating a historic species distribution model (1900-1930), projecting these models with environmental data from 1960-1990 (projected model), model species distribution using current environmental data and species occurrence records (current model), and test the ability of using projected models to predict the current models (by comparing actual current distribution) and determine whether this method is suitable to predict species distribution change over time. The accuracy of each model was determined using AUC. Models that constructed historic and current species distribution individually had high value AUC, but when historic model was used to project current distribution, it both underestimated and overestimated suitable habitat when actually compared to the current distribution. Results depended on the species of interest and how that species responds to environmental change. Using this method to predict future distribution in response to climate change can be considered reliable, but projection accuracy depends on scale (pixel vs. region). Other factors to be considered when using this method of modeling, or could make this method even stronger, should include plant responses (butterfly resources) to climate change, feeding habits of the butterfly (i.e. generalist vs. specialist butterflies), species traits and their responses to climate change, and species response to community-level changes.

Forecasting Chikungunya spread in the Americas via data-driven empirical approaches

Escobar, L. E., Qiao, H., & Peterson, A. T. (2016). Forecasting Chikungunya spread in the Americas via data-driven empirical approaches. Parasites & Vectors, 1–12. http://doi.org/10.1186/s13071-016-1403-y


The goal of this paper was to predict the spread of Chikungunya in the Americas during the epidemic using 1) ecological niche models of Aedes aegypti and Aedes albopictus, 2) air travel data as a measure of imported cases and 3) fitted curves to reported CHIKV data as a measure of local transmission.  Case data was reported from the Pan-American Health Organization by country for the Americas.  In addition to the lack of standardization in reporting, the case data showed ‘surveillance fatigue’, in which reporting became erratic and uneven in the later stages of the epidemic, suggesting that reports from earlier in the epidemic may create more accurate models. By combining imported and local cases, the model predictions based on earlier reports matched later case data, suggesting that air travel is an important and accurate predictor of country-to-country transmission.

The ecological niches were estimated using climate envelopes, which create ellipsoids, similar to a convex hull method.  The minimum-volume ellipsoid method of climate envelopes creates semi-axes which reduce the Euclidian distances between occurrence points in environmental space. Rather than using all of the WorldClim variables, the authors used a principle components analysis to reduce any correlation amongst them, and chose the first three principle components as their environmental axes. The authors chose to use occurrence data from the global distribution of the vectors, in an attempt to estimate the fundamental niche and not the realized niche.  The output of the climate envelope was a niche centroid, where the semi-axes crossed in environmental space.  Hotspots were defined as areas closest to the niche centroid in environmental space.  It seems, then, that the envelope is not a boundary classifier, but ranks locations based on distance to the niche centroid, so may not perform as well at the edges of the species range as estimators such as support vector machines. They found that the niche models generally agreed with CHIKV case data, with areas closest to the niche centroid in the Carribean, where CHIKV was first introduced in the Americas.

The use of a minimum-volume ellipsoid was well suited to the study of the start of the CHIKV epidemic because this is also the area most well-suited for the vector.  I do not think it would be as appropriate when applied to more temperate areas further from the niche centroid, because the centroid seems to be where the model is most accurate.

Ecological niche and potential distribution of Anopheles arabiensis in Africa in 2050

Drake, J. M., & Beier, J. C. (2014). Ecological niche and potential distribution of Anopheles arabiensis in Africa in 2050. Malaria Journal, 13(1), 213–23. http://doi.org/10.1186/1475-2875-13-213


Anopheles arabiensis is an important vector of malaria in sub-Saharan Africa because it is exophilic, and therefore less likely to be controlled by current elimination efforts focused on indoor residual spraying and insecticide treated nets. Drake & Beier used a presence-only method of ecological niche modeling to predict the distribution of this vector in 2050, based on climate projection models. This is one of the few studies to use LOBAG-OC since the original paper was published in 2014. LOBAG-OC was chosen because it is a better discriminator of niche boundaries, the area at which other species distribution models tend to fail. The model used 307 occurrence points, of which 246 were in the training set, and 86 environmental features constructed from WorldClim data, all of which were clipped to the African continent.  The authors conducted a principal components analysis on the environmental features to examine the gross structure and found the majority of variation was explained by the first two principal components. The fit model describes An. arabiensis as a climate generalist, because of its wide baseline distribution across the African continent.  When the fit model was applied to three climate change scenarios in 2050 based on IPCC projections, all three scenarios predicted significant reductions in area suitable for An. arabiensis.  Variation amongst the three sceanarios was calculated as a measure of uncertainty, finding strong congruence among models. The key drivers of the predicted decrease in area are temperature and precipitation during the dry season.  It is suggested that a cordon sanitaire may help control this fragmented, reduced population of malaria vectors in the future. Given the importance of urban areas in current and future vector-borne disease risk, I would be interested in seeing a similar method applied to incorporate predictions of population growth.  It may be that these reductions (many in rural areas) are counter-balanced by increases in urban areas, and the overall per capita burden is unchanged.

Spatially explicit predictions of blood parasites in a widely distributed African rainforest bird

Sehgal, R. N. M., et al. “Spatially explicit predictions of blood parasites in a widely distributed African rainforest bird.” Proceedings of the Royal Society of London B: Biological Sciences 278.1708 (2011): 1025-1033.


Predicting the potential spatial distribution of parasite species has both obvious rewards (e.g., mitigating human disease) and inherent difficulties. One of these difficulties is that the distribution of parasites is commonly determined by two different, but interacting, filters. Parasite species are obligate at some stage, meaning their distributions are constrained by host distributions. Further, they are still subject to the external environment. Here, the authors use infected host records as point occurrences to train Maximum Entropy models. Specifically, occurrence records consisted of olive sunbird hosts infected by one of two avian parasites (_plasmodium_ or _trypanosoma_). These parasites exist on other hosts, and the host likely exists outside of the area examined (West Africa). Using these occurrence records, they created geographic maps of occurrence probability of infected birds (as that is what their occurrence records are). They determined environmental variable importance (Figure 1 in the paper) for both parasites, and then combined results from a random forest analysis to predict pathogen prevalence across space. This was done by training random forests on prevalence data using environmental covariates, and then projecting the reuslts onto unsampled regions in space, constrained by the MaxEnt occurrence probability predictions. Neat idea, neat paper, lots of questions raised about their approach. There are many assumptions built-in using infected hosts as occurrence points, and even more in projecting prevalence-environment relationships onto point predictions from MaxEnt (i.e., doesn’t this assume transmission is not a function of host density, population genetics, interacting community of hosts/non-hosts, etc., but is instead only a function of environment?).

MaxEnt versus MaxLike: empirical comparisons with ant species distributions

Screen Shot 2016-03-16 at 11.29.42 AMFitzpatrick, M. C., N. J. Gotelli, and A. M. Ellison. 2013. MaxEnt versus MaxLike: empirical comparisons with ant species distributions. Ecosphere 4(5):55. http://dx.doi.org/10.1890/ES13-00066.1
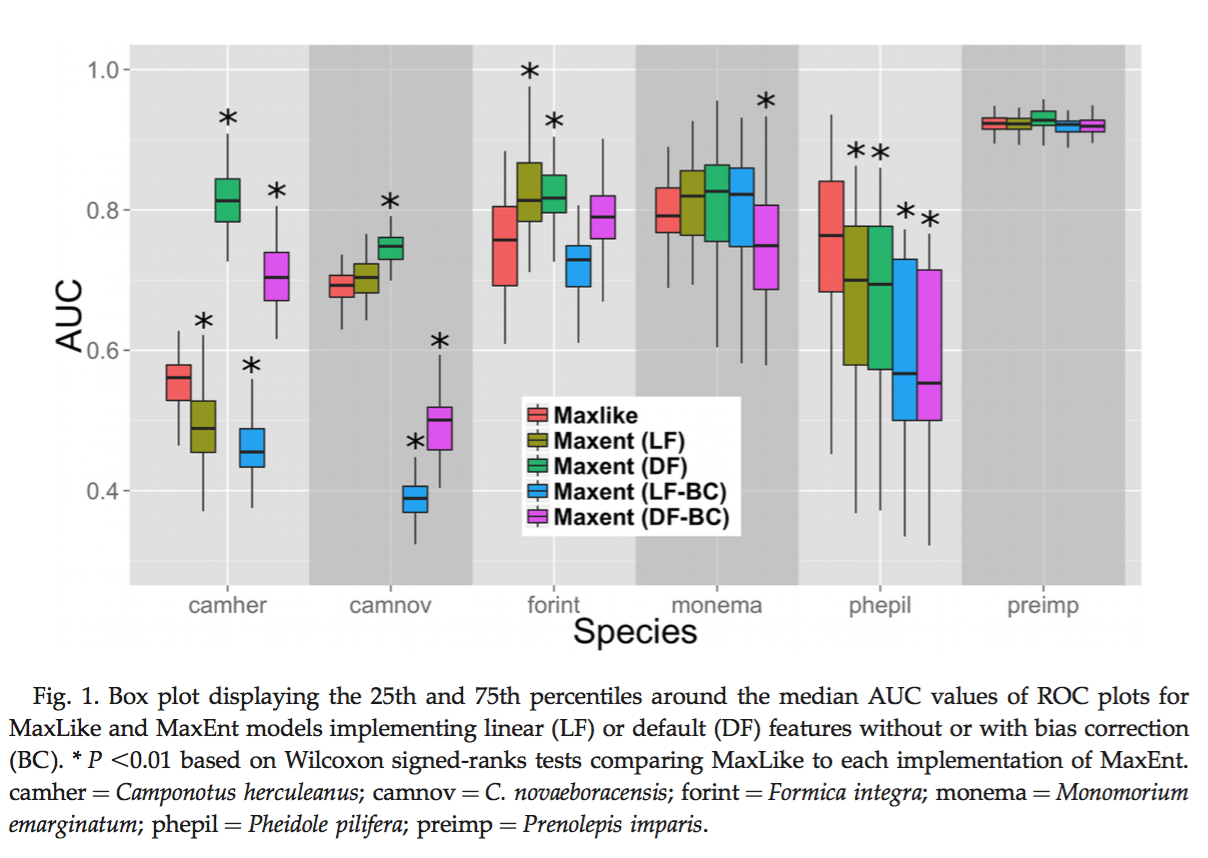
MaxEnt is one of the most widely used tools for species distribution modeling using presence-background data. Despite its popularity, the exponential model implemented by MaxEnt does not directly estimate occurrence probability but an index of relative habitat suitability. Royle et al suggested the logistic output of MaxEnt may differ substantially from underlying occurrence probabilities. MaxLike is a relatively new maximum-likelihood estimators for the probability of occurrence using presence-only data. Fitzpatrick et al compared the performance and relative merites of MaxEnt and MaxLike using occurrence records for six species of ants in New England. They evaluated model outputs in terms of their statistical fit to the traning data (AIC), their spatial predictions of occurrence relative to testing data (minimum predicted area and AUC), and their professional judgment. Though MaxEnt accounts for sampling bias and include greater model complexity, their results showed that MaxLike exceeds MaxEnt with relatively few occurrence data and limited spatial range coverage. They therefore suggested using MaxLike as alternative to the wildly-used MaxEnt framework. I think it is necessary to remain critical towards wildly-used modeling methods and think about alternatives. It would be interesting to test these two methods based on species other than ants. Since MaxLike is a relative new method, the robustness of it remains to be tested by more implications, while MaxEnt has already been used in a variety of species.

Measuring ecological niche overlap from occurrence and spatial environmental data

Broennimann, Olivier, et al. “Measuring ecological niche overlap from occurrence and spatial environmental data.” Global Ecology and Biogeography 21.4 (2012): 481-497.

  Authors put forth a new method that measures niche overlap between two similar species or the same species but in different geographic regions (endemic and invasive). The framework follows three steps: first calculate the density of species occurrence and of environmental factors along the environmental axes of a multivariate analysis, second  measure the niche overlap along the gradients in the multivariate analysis, and third compute niche equivalency and similarity. To account for differences in sampling strategy, researchers use a kernel density function in the environmental space for species occurrence. The same function is also applied to the occurence of environmental  cells.

a

Comparison of niche overlap is then determined by using the D metric.

b

Where Z1ij is species 1 occupancy and Z2ij is species 2 Occupancy, output varies between 0 (no overlap) and 1 (complete overlap). Comparing the two niches statistically entail investigating niche similarity in two geographic ranges (equivalency) and the same location (similarity).


In order to evaluate the proposed method, researchers conducted a simulation study of two virtual entities with varying degrees of niche overlap. However, the environmental parameters that drive species distribution were based off of climate conditions found in North America and Europe. Researchers also tested the provided method against two cases of species invasion. Finally, researchers compared their framework between species distribution models (EG: MaxEnt) and ordination techniques.

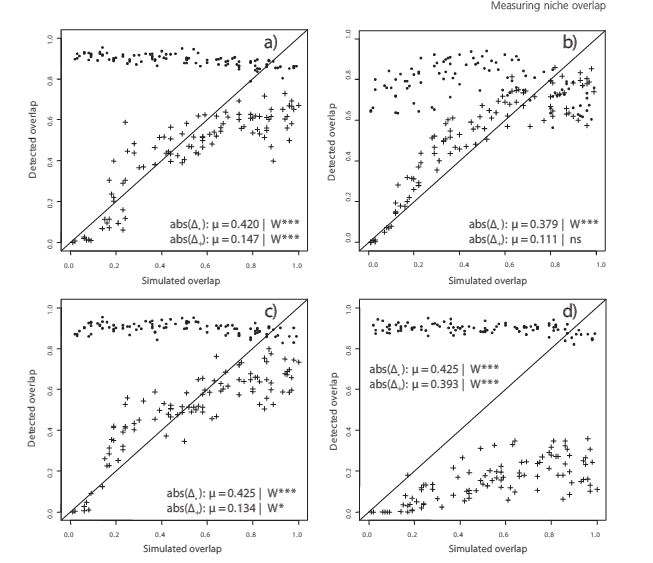
Results in niche detection were variable with traditional SDM methods (figures 3 – 5). Among ordination methods that did not depend on prior grouping, PCA-env performed best on both EU and NA sets of data. No method was considered bester amongst those that depended on prior grouping. For the SDM methods, MaxEnt achieved the best result in measuring niche overlap.

C

Figure 4. Sensivity analysis of simulated versus detected niche overlap for different SDM algorithsm. (a) generalized linear models, (b) MaxEnt, (c) gradiemt boosting machine, and (d) random forests.

Results demonstrate their ability to determine range overlap between and within species. Methods presented here improve on previous first in two ways. First, it removes the dependency of species occurrence from the frequency of different climatic conditions that can occur across a region. Secondly, smoothing species densities allows for species occurrence to be independent of both sampling effort and of the resolution of environmental. Both of these improvements help minimize the influence of of data resolution on the measurement of niche overlap.

The ability of climate envelope models to predict the effect of climate change on species distributions

Hijmans, Robert J., and Catherine H. Graham. “The ability of climate envelope models to predict the effect of climate change on species distributions.” Global change biology 12.12 (2006): 2272-2281.

DOI: 10.1111/j.1365-2486.2006.01256.x

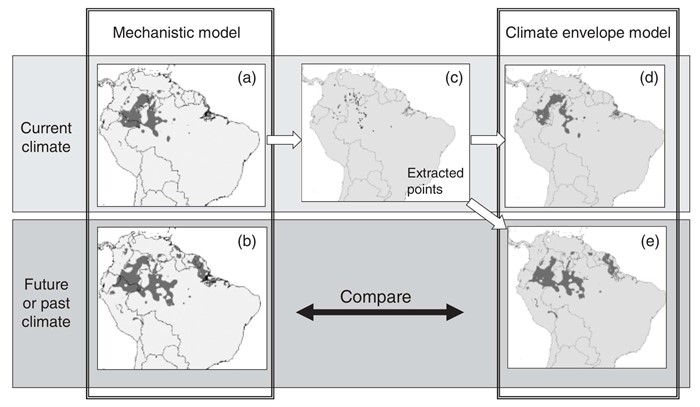
Hijman and Grahams objective was to evaluate whether Climate Envelope Models (CEM) are as successful in predicting species distribution under future climate change scenarios as it is in predicting current species distribution. They evaluated CEM ability by comparing CEM predictions with predictions obtained from Mechanistic Models (MM, which are based on an understanding of species physiology while CEMs use known geographic locations of a species to infer on their environmental requirements). They evaluated data from 100 plant species for past, current, and future distributions, by comparing MM results with four different CEM that covered a range of statistical approaches: BioClim, Domain, GAM, and Maxent and used range size, overlap index, false positive rate, and false negative rate to determine how well species distribution with CEM corresponds with MM (Generally illustrated in Fig. 1). The concern is that some CEMs may be unsuitable to predict species ranges under future climate because 1) cannot be tested using independent model training and testing data sets (i.e. no observed data for future scenarios and 2) a statistical model in which the inferred environmental requirements may not be suitable for truly classifying suitable vs. unsuitable environments. Hijmans suggests to compare results from CEM with MM, because using MM will model species distribution using physiology independent of climate. However, the only problem with MM is that physiology data is not always easy to gather. There was considerable variation between CEM and ability to reproduce the predictions from MM. Maxent and GAM provided good estimates for range shift with climate change. Domain underestimated range size. Bioclim underestimates future ranges, so would be considered a conservative approach, for example for reserve planning. Don’t even go with Domain, because it was considered too sensitive to the number of environmental variables used to predict species distribution. They came to the conclusion that some CEMs are reasonably good at predicting species dristributions under a climate change scenario.

In this paper, to assess species distribution changes in response to climate change, nonclimatic effects were eliminated. This is not very realistic however, because species distributions is likely influenced by both biotic and abiotic factors. It would be interesting to take biotic factors into account, because most likely species interactions with one another may be indirectly linked to changes in distribution driven by abiotic factors (one would persist and the other may not?). Also, applying this to vertebrate data, and even more interestingly, a migrating species, would be a great next step for using CEM to predict future species distribution.

(Figure caption: Approach used to evaluate the ability of climate envelope models to predict species distributions under different climates. A mechanistic model is used to predict the potential distribution for a species under current (a) and future (or past) (b) conditions (light gray = not suitable, dark gray = suitable). Points are extracted randomly from the area deemed currently suitable for the species (c). These points are used in the climate envelope model for current (d) and future (e) conditions. The statistical model is evaluated through a comparison of (b) and (e).)