The Combined Use of Correlative and Mechanistic Species Distribution Models Benefits Low Conservation Status Species.

Rougier, T., Lassalle, G., Drouineau, H., Dumoulin, N., Faure, T., Deffuant, G., Rochard, E. and Lambert, P. 2015. The Combined Use of Correlative and Mechanistic Species Distribution Models Benefits Low Conservation Status Species. Plos One, 10, 21. DOI: 10.1371/journal.pone.0139194

The spatial distribution of species suitable habitat has typically been projected using correlative Species Distribution Models (SDMs). Now increasing evidence suggests that rapid evolutionary change, dispersal, spatial structure of the environment, and population dynamics are also important for determining future species ranges. This paper seeks to develop a framework for joint analysis of correlative and mechanistic SDMs in order to increase the robustness of model-derived conclusions and aid resource managers involved in species conservation planning. Two previously constructed models, one correlative and one mechanistic, were used along with biological data collected from the literature EuroDiad 3.2 database which contains distribution information for European diadromous fishes from 1750-2010. Due to computational constraints a subset (73 of the 197 river basins included in the database) were used to predict species distribution using the mechanistic model. Both the correlative and predictive model correctly predicted historical presence data (before 1900) for the river basins used, though they did not predict absences within the historical data set well. In this case both models predict a high probability of self-sustaining populations of allis shad under moderate and pessimistic climate change models. This study concludes that when available predications from correlative and mechanistic modelling should be utilized in a complementary way to help guide conservation efforts in light of climate change. While the paper does provide a framework for jointly analyzing a correlative and mechanistic distribution model it only briefly addresses the issues encountered regarding the increased intensity in the amount of data and computational power required to utilize the mechanistic SDM. For now, it may be a rare case when correlative and mechanistic SDMs can be used in a complementary way as presented in this paper.

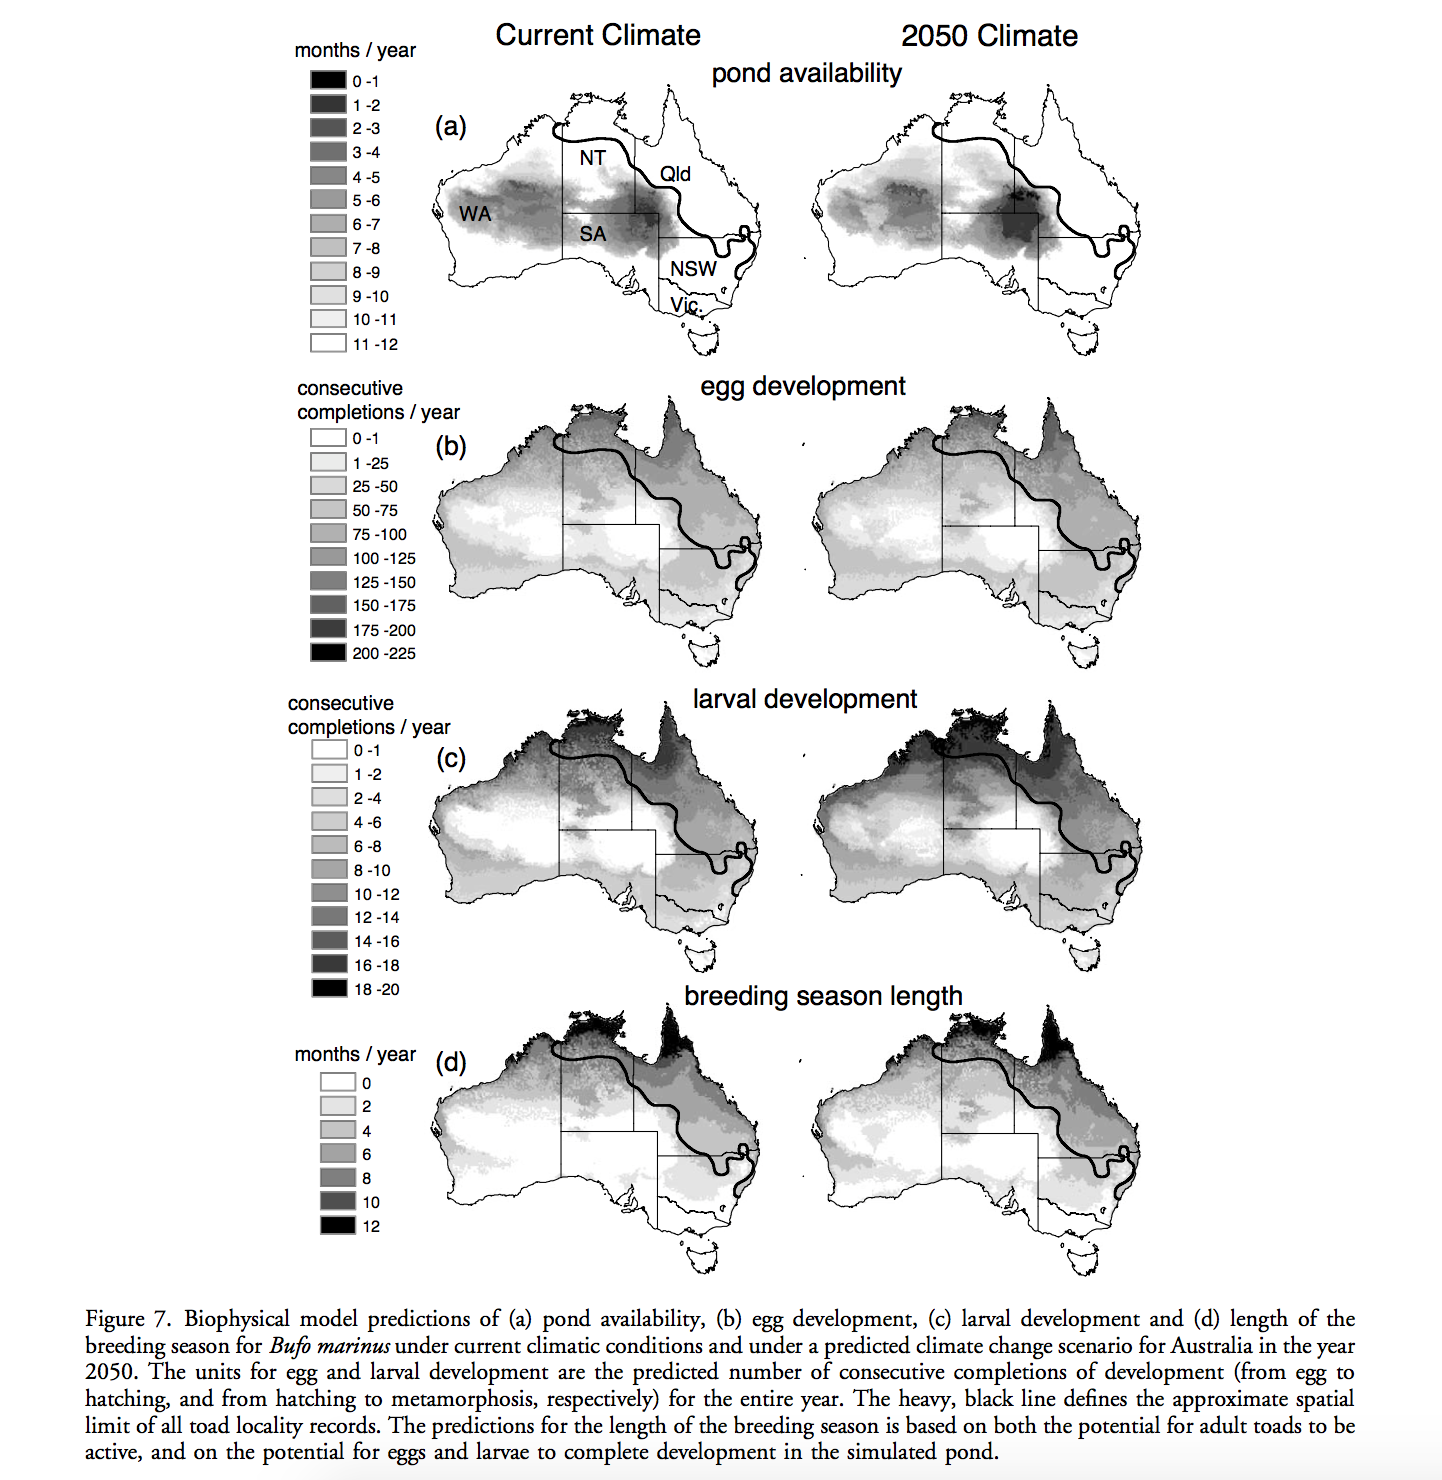
Modelling species distributions without using species distributions: the cane toad in Australia under current and future climates

Almost all approach for GIS-based distribution modeling depend in some way on species occurrence data. In range-shifting species, however, the correlative approach usually requires extrapolation to novel environments, which could lead to erroneous predictions. Kearney et. al. used an alternative approach with emphasis on the ecology of organisms based on ecophysiology and organism traits, which is independent from species current distribution. They used fine-resolution spatial dataset together with a set of biophysical and behavioral models to make the predictions of Cane Toads distribution under current and future climate in Austrilia, assessing the direct climatic constraints on their ability to move, survive, and reproduce. The results show that the current species range can be explained by thermal constrains for the adult stage and water availability for the larval stage. Their research provided a framework showing trait-based approaches can be used in investigates the range limits of any species by quantifying spatial variation in physiological constraints and therefore defining regions where survival is impossible. They claimed that mechanistic approaches have broad application to process-based ecological and evolutionary models of range-shift. In my opinion, an effective mechanistic model depends on sophisticated observational or empirical data to from the mechanism of the target organism, which maybe not that easy to obtain for all kinds of species. In addition, researchers could never capture all factors for the fundamental niche. The way Kearney et. al. addressed this problem is by identifying areas outside the niche and to locate impossible areas for the organisms. Therefore, their predicted areas are less restricted than the actual range.


Screen Shot 2016-01-27 at 12.00.43 PM


Kearney, M., Phillips, B. L., Tracy, C. R., Christian, K. A., Betts, G., & Porter, W. P. (2008). Modelling species distributions without using species distributions: the cane toad in Australia under current and future climates.Ecography, 31(4), 423-434. DOI: 10.1111/j.0906-7590.2008.05457.x

Evolutionary diversification, coevolution between populations and their antagonists, and the filling of niche space

Ricklefs, R. E. (2010). Evolutionary diversification, coevolution between populations and their antagonists, and the filling of niche space. Proceedings of the National Academy of Sciences, 107(4), 1265–1272. http://doi.org/10.1073/pnas.0913626107

It is difficult to think about ecological niches without considering the consequences for species coexistence and biodiversity. Stemming from this is the idea of “niche filling”, in that a finite niche exists and because one species is already “filling” it, another cannot persist in the same niche at the same geographical location. This has led to the theory of an equilibrium number of niche spaces, whereby diversification in one clade is balanced by a decrease in diversity in other clades. Ricklefs tested this hypothesis by analyzing several datasets of bird clade diversity and range sizes, predicting that if the hypothesis holds true, the total niche space per clade would scale with the species diversity. His results found that this was not the case, predicting this independence of niche space may be due to higher clade overlap and smaller niche space for individual species within high-diversity clades. The constraint on niche space, Ricklefs proposes, may be caused by the coevolution of pathogens. As pathogens co-evolve with their host, they keep the niche space of one particular species from expanding too broadly, thereby allowing for a higher diversity of closely related species. In the field of niche theory, the inclusion of pathogens is novel, as the ‘boundaries’ of niche space are conventionally defined by competition interactions or resource limitation. The inclusion of both pathogens and co-evolutionary dynamics in the defining of a species niche space represents an important, although somewhat daunting, step towards a further understanding of niche theory. Ricklef’s theory is based on the idea that ‘diversity begets diversity’ evolutionarily and that pathogens are host-specific and respond to the co-evolutionary arms race, otherwise known as the Red Queen Hypothesis, by host switching, and I am doubtful how often this is seen in nature.

Biotic interactions boost spatial models of species richness

Mod, H. K., et al. (2015). “Biotic interactions boost spatial models of species richness.” Ecography 38(9): 913-921.

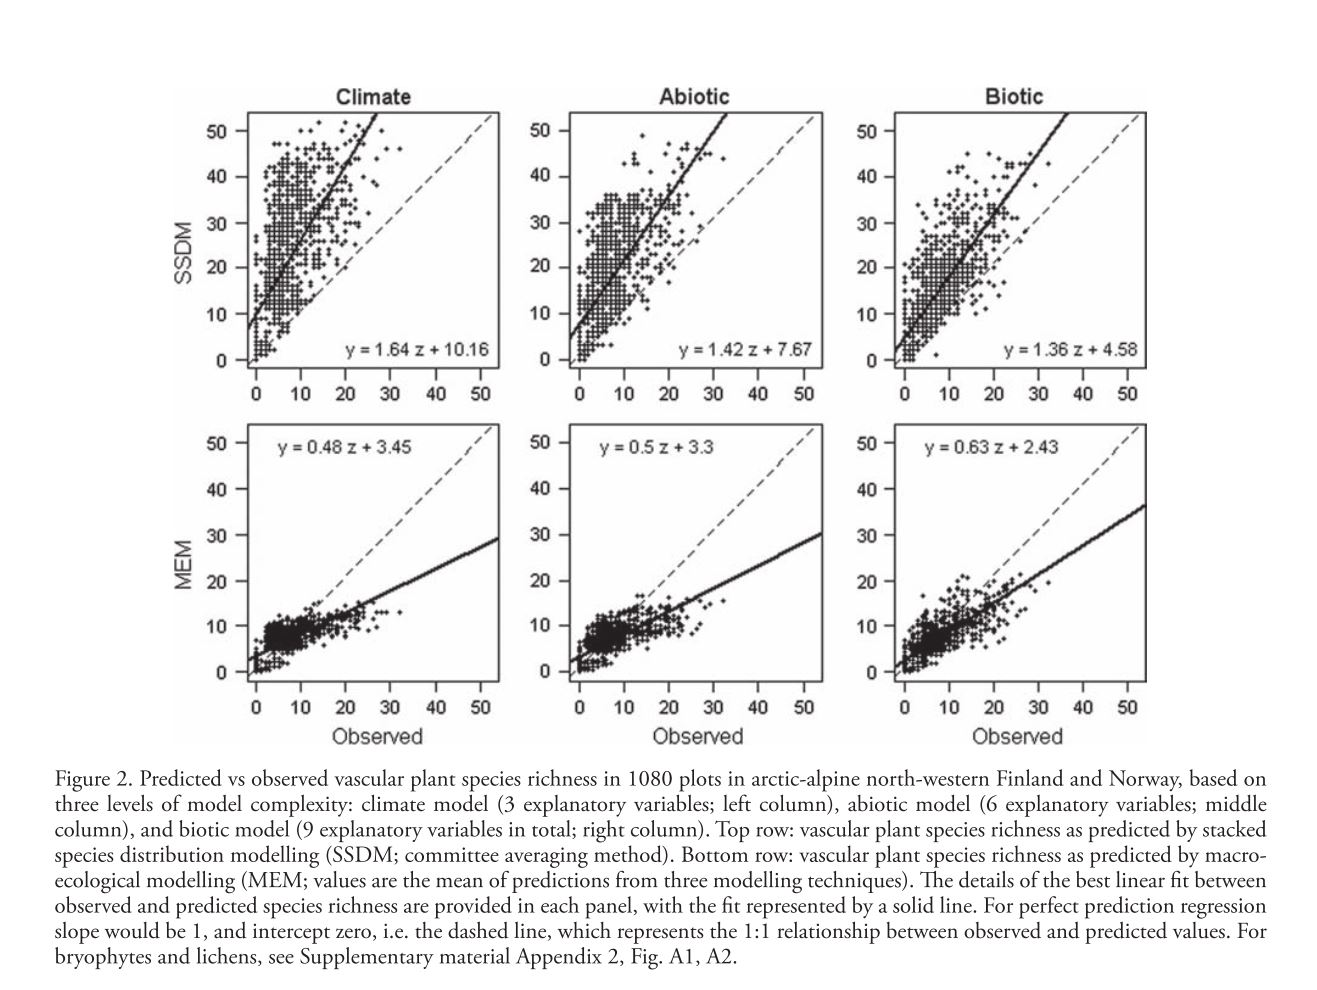
Mod et al. attempt to address the general lack of quantitative consideration of biotic interactions in spatial modeling. Rather than basic spatial distribution modeling they model species richness across a landscape with two different methods. The first, somewhat familiar, method is stacked species distribution (SSDM) in which species distribution models are fitted for all species and then overlaid to determine species richness at each point. These models are fit using Generalized Linear Models (GLMs), Generalized Additive Models (GAMs), and Generalized Boosted Models (GBMs) and SSDMs are generally expected to overpredict species richness because the simple stacking implies no intrinsic environmental carrying capacity. They also use macroecological models (MEM) which directly model species richness and implicitly consider the environment to be limiting to the number of species. MEMs do not make any distinction between different species and generally tend to overpredict richness in species-poor sites while underpredicting richness in species rich-sites. In order to ascertain the ability of biotic variables to improve prediction and potentially correct these problems the authors build 3 different types of models and fit them to 3 taxonomic groups (vascular plants, bryophytes, and lichens). The first (Climate) model includes mean air temperature of the coldest quarter, growing degree days, and ratio of precipitation to evaporation, all broad-scale environmental drivers known to have a strong impact on vegetation. The second (Abiotic) model includes the Climate model as well as soil quality, soil wetness, and solar radiation as finer scale abiotic predictors. Finally the third (Biotic) model includes all previous predictors and the cover of three dominant species known to have impacts on the distribution of other species. These three species show both competition and facilitation based effects on a number of different species. In order to determine the fit of different models a linear regression was fitted to the plot of predicted vs. observed species richness (slope = 1 and intercept=0 represents perfect prediction). The inclusion of biotic variables increased fit and decreased bias for both methods across all taxa, the regression slope and intercept more closely approaching the ideal values. Mean AUC values averaged across all species models built for SSDM were higher as well. The fact that inclusion of biotic variables significantly improved fit across two different modeling methods strongly supports the extra explanatory/predictive power this data can offer. The widespread application of these methods relies, however, on the accurate determination of important biotic variables. This study was able to approximate competition pressure using the cover of 3 dominant species, an assumption which may be generalizable to a number of shade/nutrient limited plant systems. Systems with a more diverse and “evenly distributed” competition landscape may be very difficult to model in this way because knowledge of many species’ distributions across the landscape may be necessary to build these models.mod et al. figure

The fundamental and realized niche of the Monterey Pine aphid, Essigella californica (Essig)(Hemiptera: Aphididae): implications for managing softwood plantations in Australia

Wharton, Trudi N., and Darren J. Kriticos. “The fundamental and realized niche of the Monterey Pine aphid, Essigella californica (Essig)(Hemiptera: Aphididae): implications for managing softwood plantations in Australia.” Diversity and Distributions 10.4 (2004): 253-262.

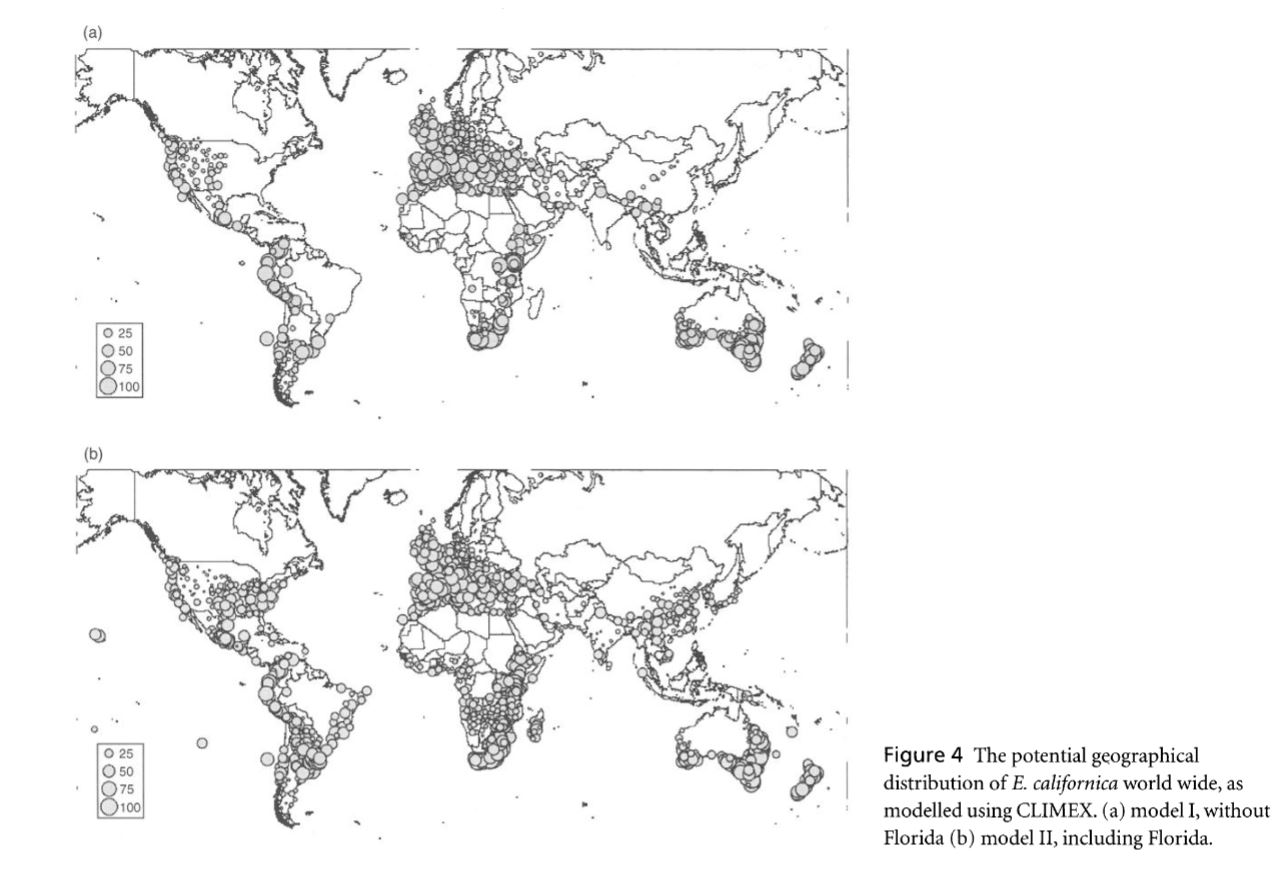
Wharton and Kriticos build two predictive models of the global distribution of the Monterey pine aphid Essigella californica. E. californica is native to western North America, from Southern Canada to Northern Mexico but has recently expanded to Europe, South America, Australia, and, notably, one record in southern Florida. Unlike in its native range E. californica poses a substantial threat to expanding pine timber plantations in Australia. The authors used a CLIMEX model, which can be fit using either lab based measures of temperature and moisture based growth/stress or inference of these parameters based on known distributions. CLIMEX considers both the potential for population growth under favorable conditions and the probability of population survival under climatic temperature and moisture based climatic stressors. Models were initially fit to the North American distribution of E. californica, using the CLIMEX model of the Russian wheat aphid, Diuraphis noxia, as a template, and validated using the Australian distribution. A first model (I) was fit without the potentially anomalous point in Florida and a second (II) was fit including this point. Stress indices range from 0 (no stress) to 100 (lethal conditions) while growth indices range from 0 (no growth) to 100 (optimal growth conditions throughout the year). Stress effects are based on cold stress, heat stress, dry stress and hot-wet stress, with stress accumulating weekly based on threshold values. The model (I) excepting the Florida point relatively accurately predicts the North American distribution while failing to predict E californica’s ability to persist north of the News South Wales/Queensland Border in Australia due to a limit imposed by hot-wet stress. Model (II) fit using the single Florida presence point far more accurately predicts distribution in Australia while substantially overpredicting distributions across the Midwestern, Eastern, and Southeastern United States. The authors come to the conclusion that the known distribution of E. californica most closely resembles the predictions of model (II). They suggest that biotic factors, including limited pine diversity and competition with other Essigella species, are likely preventing the spread of E. californica eastward to the areas predicted by model (II). Most pine plantations occur in regions within the potential distributions of this model suggesting high risks of further E. californica expansion and the economic damage that would accompany it. The CLIMEX modeling concept of Stress/Growth Potential may more closely approximate the mechanistic relationship between seasonal climate and population persistence than simple association based models. This analysis suffers, however, from a substantial amount of over-prediction with limited, qualitative explanations and highlights the need to effectively account for biotic interactions in SDMs.Wharton and Kriticos figure

Modelling ecological niches with support vector machines

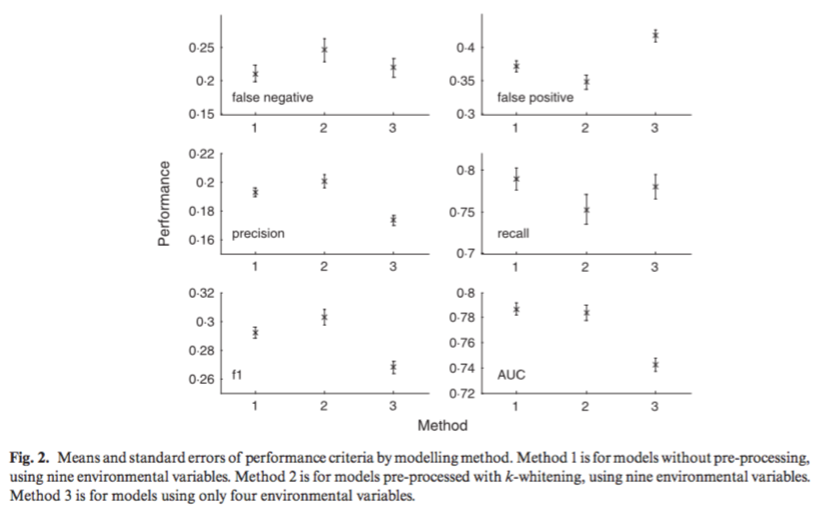
Drake, Randin, & Guisan (2006) tested the method of support vector machines (SVMs) to map ecological niches using presence-only data for 106 species of woody plants and trees in a montane environment with nine environmental covariates. Support vector machines (SVMs) utilize machine-learning techniques designed to model one type of data only by finding statistical patterns and then removing outliers to estimate the support of high-dimensional distributions. The support of the distribution of a species’ environmental requirements is analogous to Hutchinson’s ecological niche concept. In situations with presence-only, SVMs are simpler (and differ from other methods) because they eliminate the requirement for pseudo-absence data. This paper compares three ways of using the SVM approach: (1) using no pre-processing or data reduction to the nine environmental covariates, (2) pre-processing training data using k-whitening, and (3) restricting covariates by removing highly correlated environmental variables. They found that method 1 resulted in models with the highest recall (ratio of number of correct predictions to total number of observations) and lowest false positive rate. Method 3 performed the worst overall, suggesting that useful information about ecological niches can be obtained by the inclusion of more environmental variables, even if they are highly correlated. Additionally, they found that the SVM method required approximately the same amount of observations as comparable methods, and resulted in similar AUC values for prediction. This paper helped to develop a background understanding of the literature on machine-learning techniques to model presence-only vs. presence-absence data and how the aforementioned methodological differences determine whether a species’ fundamental or realized niche is being modeled.

Drake, J.M., RANDIN, C. & GUISAN, A., 2006. Modelling ecological niches with support vector machines. Journal of Applied Ecology, 43(3), pp.424–432.Differing performances of 3 methods of using SVMs

Modeling the spatial distribution of two important South African plantation forestry pathogens

Van Staden et al. (2005) used a bioclimatic species distribution model to find the broad habitat distribution and potential distribution of two fungal pathogens of commercially important tree species, pines and eucalyptus, in South Africa under varying climate change scenarios. The distribution and infectivity of both pathogens are affected by certain climatic parameters (e.g. hail damage, high rainfall, and humidity) and climate change impacts these variables. Fungal incidence data for the study consisted of 87 confirmed reports of S. sapinea and 17 reports of C. cubensis and climate data for the area were obtained from existing literature and a digital elevation model for South Africa. Climate data included five variables: altitude, average rainfall of driest and wettest month, and average temperature of hottest and coldest month. The bioclimatic model incorporated these five variables, created a multidimensional scatter plot using for each variable for each grid cell in South Africa (11,800 total), generated matrix of covariates for each cell, and then transformed that matrix into a probability of occurrence for each fungus for each cell. Consequently, they were able to identify core-risk regions for both fungi, and found that those regions included major commercial forestry plantations. They report this as the first study to utilize a bioclimatic model to predict the distribution of economically relevant pathogens for eventual use in decision support systems for forestry management. This study could be improved by increased data on the fungus (more than 100 counts of each) and potentially exploring the variation in predictions generated by the model. It would be interesting to explore different combinations of variables or data points and how the predications would change based on each combination.

van Staden, V. et al., 2004. Modelling the spatial distribution of two important South African plantation forestry pathogens. Forest Ecology and Management, 187(1), pp.61–73.

Fast and flexible Bayesian species distribution modelling using Gaussian processes

Golding and Purse suggest that Gaussian process (GP) species distribution models (SDM) via Bayesian priors may be beneficial for ecologists that wish to incorporate prior knowledge of their system and retain the speed and accuracy of predictions granted by other models. Gaussian processes are able to fit complex (i.e. more statistical terms) statistical models, but typically require computationally extensive methods (e.g. Markov chain Monte Carlo methods). Consequently, the authors evaluate another method of incorporating GP SDMs by comparing its predictive ability and run time with other commonly used approaches in a dataset from the North American Breeding Bird Survey for both presence/absence and presence-only data. Models compared in their study include: a GP model, a generalized additive model (GAM), and a boosted regression tree model (BRT). Instead of fitting GP SDM models with MCMC, they evaluate the efficacy of a more efficient deterministic inference procedure called Laplace approximation and expectation propagation. Deterministic approximations are subject to error that may decrease accuracy of predictions, but the authors argue that even with these limitations GP models fitted with deterministic inference are a promising method for SDM analyses. They found that the predictive accuracy of GP SDMs fitted by Laplace approximation was higher than BRT, GAMs, and logistic regression for presence/absence data and higher than all compared models for presence-only data. Additionally, GP SDMs were just as fast as GAMs. For situations when data on species occurrence is sparse, such vector abundance and distribution, but distributions of hosts is better documented (e.g. cattle or humans) this method would allow integration of multiple types of prior information.


Golding, N. & Purse, B.V., 2016. Fast and flexible Bayesian species distribution modelling using Gaussian processes. Methods in Ecology and Evolution. doi: 10.1111/2041-210X.

Species distribution models that do not incorporate global data misrepresent potential distributions: a case study using Iberian diving beetles

Species distribution models have been used since the 1980s to predict probable distribution using a combination of species occurrence data and predictive environmental data thought to influence their distribution. While distribution modeling presents a way to predict species distribution with incomplete data, using data that does not encompass the entire range of a species may lead to geographic bias in the potential distribution predicted by the model. This study aims to determine whether modeling using regionally biased data predicts incomplete potential distributions and examine why regional data may not adequately describe the potential distribution. Their results show that distributions predicted with regional data provide an incomplete description of the environmental limits of a species when compared to distributions modeled using data covering the entire species range. Due to this issue it is recommended that potential distributions be modeled using data from all known populations or a subsample from population across the entire range. While this study reflects the importance of utilizing data from across the entire known range when trying to predict potential distributions as predicted by climate it does not consider other factors that may influence distribution. Some areas within the range of the beetles do not have records of presence which may be due to limitations of the natural dispersal of these species as opposed to the climate variables in those areas.


Sanchez-Fernandez, D., Lobo, J. M. and Hernandez-Manrique, O. L. 2011. Species distribution models that do not incorporate global data misrepresent potential distributions: a case study using Iberian diving beetles. Diversity and Distributions, 17, 163-171. DOI: 10.1111/j.1472-4642.2010.00716.x

Anonymous nuclear markers reveal taxonomic incongruence and long-term disjunction in a cactus species complex with continental-island distribution in South America

Motivation:The Pilosocereus aurisetus complex is comprised of 8 cactus species associated with the rocky savannas in eastern Brazil. Species have been defined by morphological and genetic traits. However, different genetic markers lead to different conclusions. For these reasons the authors attempt to answer the following questions regarding the complex diversification:

(1) Are the northern P. aurisetus populations more related to the other conspecific populations in the Espinhaço Mountain range or to population from other species in Central Brazil, as shown by cpDNA data?

(2) Is the currently recognized P. machrisii species composed of two distinct lineages?

(3) What is the relationship of P. jauruensis with the other species of the complex?

Additionally,  the authors also tested climatic niche differences between the observed geographic lineages with the hopes of making some inference of the complex’s phylogeographical history.

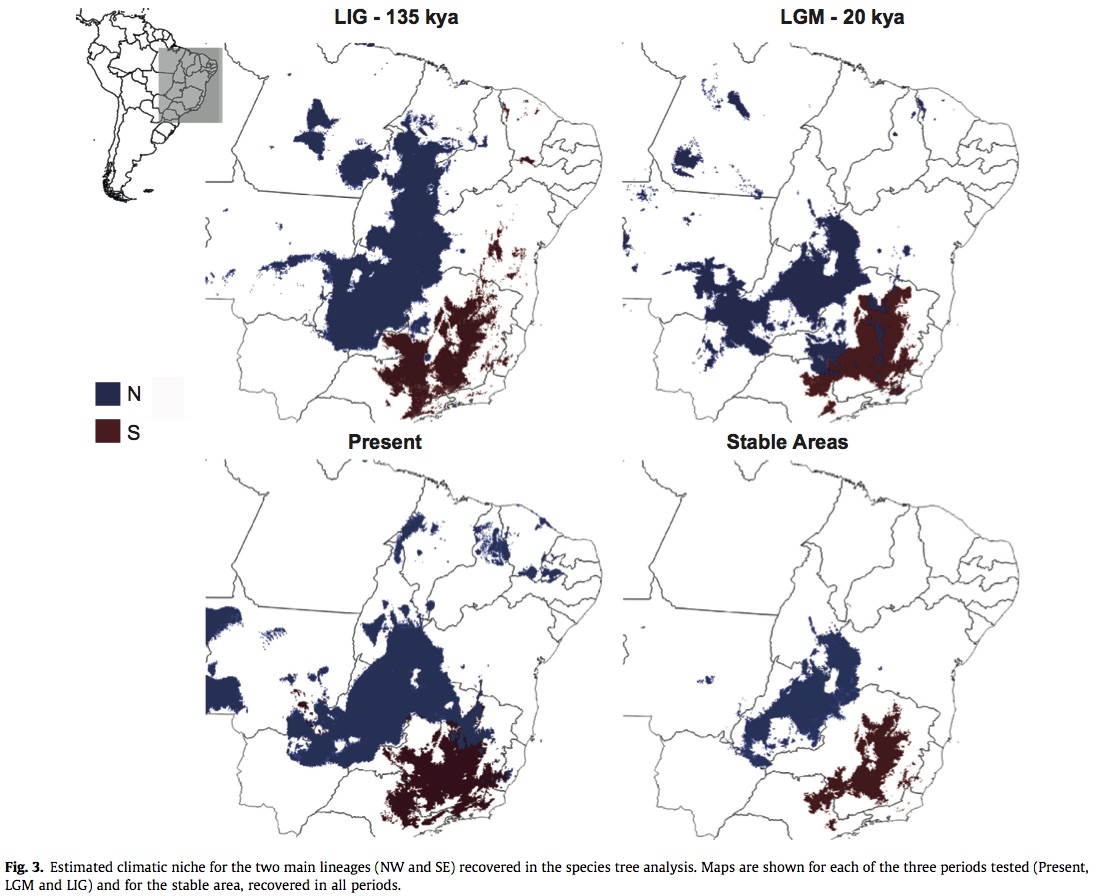
MethodsAmplicons from AFLP of 40 Pilosocereus samples consisting of 4 species from P. aurisetus species group and and out group. These species have the widest distribution and were the most phylogenetically unresolved. Sequences were processed to identify loci and then alleles across the species and populations.  The alleles were used to infer the most likely number of interbreeding groups in the data set without any sampling site information.  The most likely number of interbreeding groups were then treated as operational taxonomic units (OTUs) and used to estimate a species phylogenic tree.  Species occurrence data was obtained by GPS measurements during transacts of the range in addition to occurrences in the global biodiversity information facility. Sample sizes were generally small for each species and therefore not prone to over fitting. Climatic divergence in addition to genetic divergence was tested by grouping the occurrences according to the genetic lineages recovered by phylogenic analysis. The effects of past climatic oscillations on the niche of each lineage were determined by fitting the models in the present, 21 kya (LGM), and 135 kya (LIG) scenarios using 3 different algorithms. Of the 19 BIOCLIM variables, the authors used 6 which were which were showed to have low correlation and high informativeness. The model outputs were converted into presence/absence data based on a threshold value where the ratio of true positives to actual positives and true negatives to actual negatives is equal. In a area with at least 3 overlapping projections was considered suitable – climactic stable areas were suitable in all 3 time periods.

Results and Discussion: The genetic analysis inferred 5 mating groups split between two main geographic lineages. The two lineages had minimal overlap in all time periods, this overlap was even smaller far stable areas (overlap in all three times). The climatic niche does not appear to have changed over time indicating that range shifts were not crucial for present day distributions. 

Perezetal_Image

Thoughts: The genetic analysis was very thorough and well developed. However, the niche mapping wasn’t fully integrated into the rest of the study.  I think this is a good example of the consequences of developing easy to use data (WorldClim). It is not really clear how the determining the climatic niche over time strengthen the authors’ phylogenetic conclusions.


Manolo F. Perez, Bryan C. Carstens, Gustavo L. Rodrigues, Evandro M. Moraes. Anonymous nuclear markers reveal taxonomic incongruence and long-term disjunction in a cactus species complex with continental-island distribution in South America. Molecular Phylogenetics and Evolution. Volume 95, February 2016, Pages 11–19 doi:10.1016/j.ympev.2015.11.005