Evaluating alternative data sets for ecological niche models of birds in the Andes

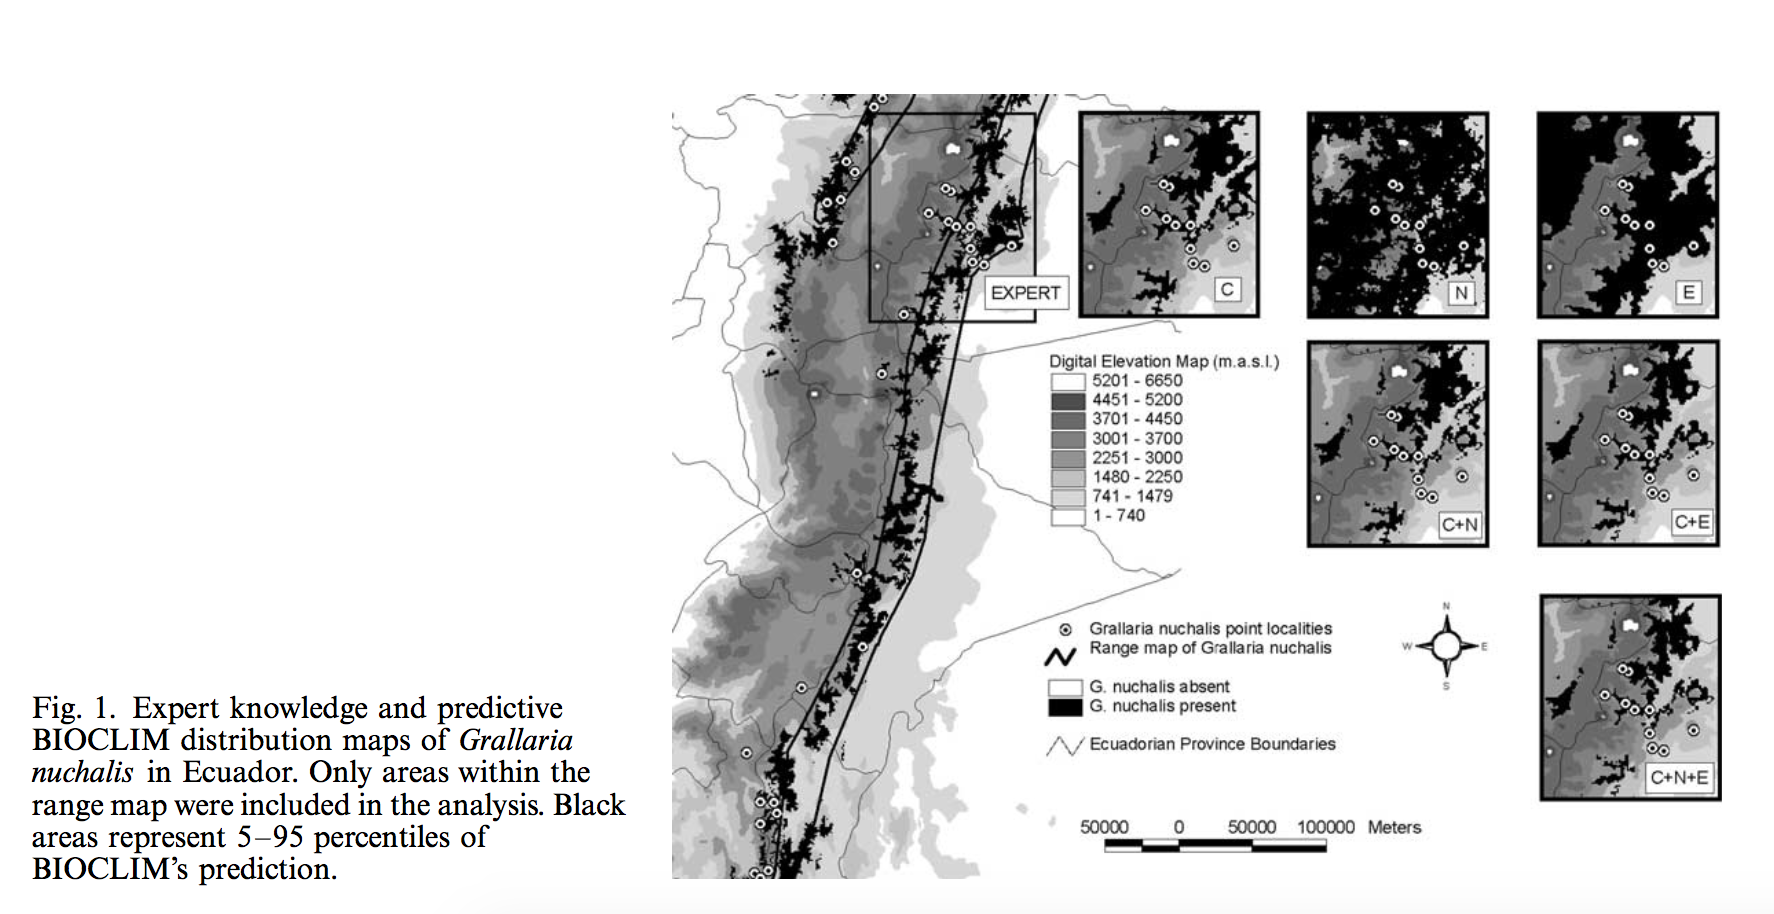
Typically, researchers use interpolated climate data or remotely sensed environmental data to build Ecological niche models (ENMs). Parra et. al. conducted the first assessment of the relative performance of models created by three different datasets: climate data, Normalized Difference Vegetation Index (NDVI), and elevation data. They compared predicted versus expected distribution of six bird species in the Ecuadorian Andes. They developed seven models based on three datasets and all their combinations using BIOCLIM. Predictive maps were compared with expert knowledge based maps, and sensitivity, specificity, positive predictive power, and Kappa were calculated. They found that models included climate variables performed well across most measures, whereas ones only use NDVI performed the worst. In the mean while, elevation data based models showed high over-prediction errors. They concluded that it is usually beneficial to include various datasets into ENMs when possible. Data quality of remote sensing data should be evaluated carefully before being included, especially for regions with complex topography or cloudy weather. This comparison result, however, may revealed a regional trend for Ecuadorian Andes but not a general rule, considering the special landscape, high levels of endemism, and species richness of the study area. Therefore, similar modeling comparison will benefit further understanding for effects of data choosing on ENMs.

Screen Shot 2016-01-19 at 10.26.49 PM

Sensitivity of predictive species distribution models to change in grain size

Sensitivity of predictive species distribution models to change in grain size

When using species distribution models, grain (resolution) size is a spatial factor that may influence predictive model outcomes. Guisan et. al. (2007) tested the effect of grain size on SDM by comparing model performance of 10 predictive modelling techniques (DIVA-GIS, DOMAIN, GLM, GAM, BRUTO, MARS, BRT, OM-GARP, GDMSS, and MAXENT-T) on presence only data of 50 species in 5 different regions (from Elith et al 2006) and also determined whether affects observed were dependent on the type of region, modelling technique, or organism considered. Model performance at two grain sizes (original and 10-fold) was assessed and prediction success was compared and ranked using Area under ROC curve. Increasing grain size did not affect model performance however it did degrade models on average. Although surprised by the outcome, the somewhat fundamental question reflects realistic issues in SDM. The testing 10 modelling techniques was a well thought out approach to determining factors that apparently aren’t influenced by grain (unless original data lacked predictive power that wouldn’t be influenced by scale anyway). It would be interesting for a follow up paper to test other variables that may be more affected by changes in grain size (sessile organism, species with small home ranges, or factors at the microhabitat level).

Physiographically sensitive mapping of climatological temperature and precipitation across the conterminous United States

Daly, C., Halbleib, M., Smith, J. I., Gibson, W. P., Doggett, M. K., Taylor, G. H., et al. (2008). Physiographically sensitive mapping of climatological temperature and precipitation across the conterminous United States. International Journal of Climatology, 28(15), 2031–2064. http://doi.org/10.1002/joc.1688

Daly et al. created a 30 arc-sec climate map of the continental United States, mapping mean monthly precipitation, and minimum and maximum temperature, referred to as the PRISM map. Similar to other models, they interpolated point weather station data from 1971-2000 over a grid using a climate-elevation regression. Station data was weighted based on nine PRISM algorithms that incorporated spatial clustering and relevant topographic data, including coastal proximity, temperature inversion potential, and location on topographic slopes. Including data such as this allowed the model to more accurately predict local climatic events such as temperature inversion in valleys and rain shadows. To clean and validate the data, local experts were brought in for each region, in addition to manual exclusion of extreme and data errors. Daly et al. used two measures of uncertainty to evaluate their model, jack-knifed cross-validation and a 70% regression prediction interval. Error was highest in the more physiographically complex areas of the US, as expected, and the two measures performed similarly with increasing area scale. When compared to Daymet and WorldClim, PRISM better predicted temperatures at high elevation, because of its inclusion of the two-layer temperature inversion, while Daymet and WorldClim had a cold bias in these areas. Additionally, the inclusion of regional coastal algorithms for the different coasts of the US led to more accurate depictions of coastal temperatures in California than the other maps. In less complex areas, such as the MidWest, however, all three maps performed similarly. The inclusion of more topographic complexity in PRISM is an improvement over similar climate grids of the US, especially in the Pacific Northwest, but offers little benefit in areas of shallow elevation gradient in the middle of the country. When available, it seems logical and worthwhile, in my opinion, to include this additional complexity, as climate is not solely dependent on elevation and does not incorporate finer scale differences.


Because they do not have temperature inversion along slopes, both Daymet and WorldcClim have a strong cold bias at high elevations.
Because they do not have temperature inversion along the elevation gradient, both Daymet and WorldClim have a strong cold bias at high elevations.

The role of land cover in bioclimatic models depends on spatial resolution

DOI: 10.1111/j.1466-8238.2006.00262.x

The spatial scale on which species distribution modeling is undertaken is of fundamental importance for ecological studies. The current paradigm indicates climate governs species distribution on broad biogeographical scales whereas land cover and habitat suitability affect species occupancy patterns, especially at fine resolution. With this context, Luoto et. al. tested whether the integration of land cover data affect bioclimatic models by constructing Generalized additive models for 80 bird species as a function of (1) pure climate and (2) climate and land cover variables. Models were constructed at 10km, 20km, 40km, and 80km resolutions. They evaluated their models using area under the curve (AUC), and found that model performance generally increased when land cover was included at 10km and 20km. In contrast, the inclusion of land cover decreased model AUC at 80km resolution. Therefore, they concluded that the determinants of bird species distributions are hierarchically structured, and that integrating land cover at 10km-20km resolution can improve our understanding of biogeographical patterns of birds in their study area. This paper examined effects of spatial resolution over a range of scales. However, whether a certain spatial resolution is fine or course is species-dependent and question-driven. It would be interesting to discuss about a protocol that help determine appropriate spatial scale for general species distribution modeling.

2 (1)
Projected distributions of two species with different modelling accuracies and habitat preferences: the occurrence of marsh harrier (Circus aeruginosus): (a) climate model and (b) climate-land cover model; and the occurrence of grey-headed woodpecker (Picus canus): (c) climate model and (d) climate-land cover model. Black dots represent the sampling plots where the species was present, and shaded areas are the areas modelled as suitable for the species. To determine the probability thresholds at which the predicted values for species occupancy are optimally classified as absence or presence values, we used prevalence of the species as the probability level as suggested by Liu et al. (2005). D2 = percentage of explained deviance and AUC = the area under the curve of a receiver operating characteristic (ROC) plot.

SDMdata: A Web-Based Software Tool for Collecting Species Occurrence Records

Obtaining data dynamically and programmatically is necessary for reproducible research. This a blanket statement. What I mean specifically is that the ability to access data programmatically from a source that is version controlled allows for the consistent use of data. Currently, many databases are accessible through web-based interfaces, but have no API or method to access the data programmatically. This matters because subsequent analysis of the data is based only on that snapshot from a potentially dynamic database. Ideally, a complete workflow would include pulling the data from a database, cleaning it, analyzing it, and outputting results. This paper introduces a tool to download and clean species occurrence data from GBIF (Global Biodiversity Information Facility). This tool is web-based, written in Python, that takes a species name list, and outputs occurrence data from GBIF. They argue that the current _R_ implementation (`rgbif`) is flawed because of memory limitations (which is a pretty facile argument). I do like that `SDMdata` has an error-checking feature that will flag suspected errors. However, the proliferation of tools to query databases tends to “muddy the waters” in my opinion. Several resources already exist for programmatic data acquisition from GBIF in R, SQL, and Python. Perhaps this tool adds something novel; perhaps we should focus on making existing tools better.


Link to paper

Link to software 

Not the time or the place: the missing spatio‐temporal link in publicly available genetic data

Data archiving is mandatory for many journals in order to encourage data openness, and the re-use of scientific data. However, **how** the data are archived can be really important in determining the usefulness of the data to researchers. Further, data archiving itself does not ensure that the study which the data was used is reproducible. This article demonstrates that 31% of genetic datasets archived as a condition for publication in _Molecular Ecology_. This was largely a metadata problem, in that the data and metadata were not linked well. Furthermore, the quality of the data was a bit coarse in some instances, with geographic data provided in terms of geopolitical location instead of geographic coordinates. Taken together, the authors stress that the data deposition policy has promoted the re-use of data, and the quality of data has increased from 2009 – 2013, but that current genetic data formats that do not allow the inclusion of metadata should be revised, and that data should well-documented and curated in an appropriate repository instead of as a supplementary file.


Article available here

Interpretation of Models of Fundamental Ecological Niches and Species’ Distributional Areas

Soberón and Peterson present a discussion that considers two broad ways that researchers generally estimate the fundamental niche of a species. The first method discussed is the mechanistic approach which considers the studied physiology that contributes to positive fitness with information provided from a geographic information system to display suitable habitats. The second method indirectly identifies important characteristics of species fitness by utilizing survey data and climate factors associated with species occurrence. While the first method may provide a deeper understanding of within species drivers that contribute to their distribution, it may neglect the effects of species interactions. While the second method provides opportunity to explicitly model species interactions, yet the correlative approach may be subject to some bias. Soberón and Peterson also consider what role scale plays in species distribution, and how various factors can differ in their importance due to changes in scale. Another consideration is how absence species information needs to be carefully considered with regards to study objective. Lastly, Soberón and Peterson stress the importance for model validation and suggest the need for well developed methods. This paper provides insight into key differences between mechanistic niche modeling and the ‘correlative approach’. However, one improvement to the findings in this paper could be a better developed case study (potentially two) or more mathematical reasoning.

Soberon2005

DOI: http://dx.doi.org/10.17161/bi.v2i0.4

Changing habitat areas and static reserves: challenges to species protection under climate change

Garden, J. G., O’Donnell, T. and Catterall, C. P. 2015. Changing habitat areas and static reserves: challenges to species protection under climate change. Landscape Ecology, 30, 1959-1973. DOI: 10.1007/s10980-015-0223-3

Changing climates can lead to shifts in the spatial distribution of a species and its suitable habitat, potentially altering the effectiveness of previously fixed protected areas. This paper develops a broad approach to characterizing species’ climate-induced distributional changes due to location displacement or refugial dynamics along with the effectiveness of the protected area network. Distributional data, climate data, and other environmental data were used to produce species distribution models for 13 species. Areas of suitable habitat for each species were predicted according to three climate regimes and overlaid with GIS maps of protected areas. Suitable habitat extent decreased across climate regimes for all 13 species as did the proportion of refugia extent within the original suitable habitat extent. The amount of protected habitat decreased under future climates though this is likely due to overall decreases in the habitat extent as the proportion of habitat protected in the study area did not change over time. This study forecasts a decline in suitable habitat for forest obligate species within the study area as the climate changes. Patterns of species response to the changing climate were better characterized by refugial dynamics rather than location displacement. These findings are consistent with species ranges shrinking in the future around refugia within or near the current distribution as opposed to shifting in location. The purpose of this study was to predict the impact of climate change on the habitat extent of these species and as such other threats to habitat, such as deforestation, were intentionally not considered. In order to better predict suitable habitat extent future research would need to include all threats to habitat in the study area.

Competitive Interactions between Tree Species in New Zealand’s Old-Growth Indigenous Forests

Leathwick, J. R., & Austin, M. P. (2001). Competitive Interactions between Tree Species in New Zealand’s Old-Growth Indigenous Forests. Ecology, 82(9), 2560–2573. DOI: 10.2307/2679936

A major limitation of current species distribution models is the exclusion of biotic predictors and species interactions in models. It is difficult to separate the spatial patterns of species interactions and environmental covariates in a model because the distribution of non-focal species is itself dependent on environmental covariates. The Nothofagus forests of New Zealand, however, present an ideal natural experiment, because their species distribution is based on historical landscape shifts, not environmental covariates, enabling the inclusion of Nothofagus presence- absence in a model without confounding the abiotic covariates. To examine the contribution of species interactions to SDMs, Leathwick and Austin fit GAMs to New Zealand tree species, including both environmental factors and presence-absence of Nothofagus species, and the interaction between environmental variables and competition. Environmental regressions in the absence of competition were first created for each species. Terms describing Nothofagus density and an interaction between Nothofagus density and temperature were then added to the regression. A reduction in deviance due to the addition of a term was interpreted to mean that the factor did influence the focal species distribution. The addition of competition significantly reduced the deviance for all species, and did so on a larger magnitude than did the environmental covariates, except for mean temperature, suggesting that competition significantly impacts species distributions. Additionally, including competition in the SDMs led to an upwards shift in species’ optimal temperature. The authors validated their model by comparing predictions using environment-only regressions and environment-competition regressions for two data sets. The environment-competition model seemed to predict species distributions more accurately, but this accuracy was not assessed quantitatively. Leathwick and Austin’s results suggest that future SDMs must take into account more realistic species interactions, as in some cases, they influence species distributions WORD at least as much as environmental covariates. However, their reliance on reduced deviance as proof of the role of competition could be improved upon by using a more rigorous, quantitative training method. Further work exploring the interaction between competition and environmental covariates, and that competition potentially alters the thermal niche of species, should be done and would be especially relevant in the face of climate change.

Inclusion of Competition in Models Led to Decreased Density of Focal Species