Machine Learning Methods Without Tears: A Primer for Ecologist

Olden, Julian D., Joshua J. Lawler, and N. LeRoy Poff. “Machine learning methods without tears: a primer for ecologists.” The Quarterly review of biology 83.2 (2008): 171-193.

DOI: 10.1086/587826

Overview

This paper was designed to help facilitate the application of machine learning techniques into the field of ecology. Authors posit that despite the advantages of machine learning techniques, ecologists have been slow in integrating these methods into their research due to lack of familiarity. It is the intent of this paper to provide background information on three categories of machine learning and examples of use in the ecological literature.

Classification and Regression Trees (Cart)
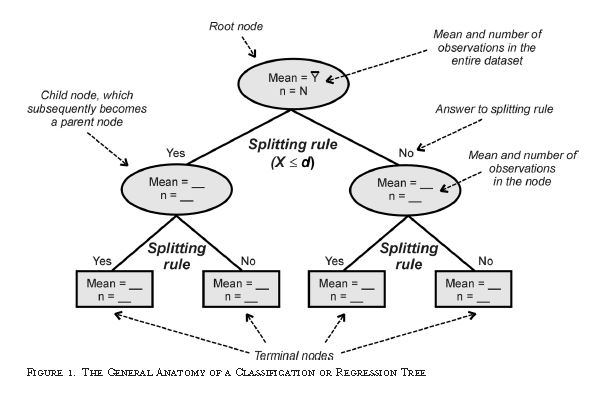
Cartdiagram

Carts can are a form of binary recursive partitioning where classification is based upon making splits within the provided dataset. The three basics of a cart algorithm involve tree building, stopping the tree building, and tree pruning and optimal selection. One of the biggest strengths of carts compared to other machine learning methods is that they’re relatively easy to interpret. One weakness is that decision trees are typically unstable.

Artificial Neural Networks
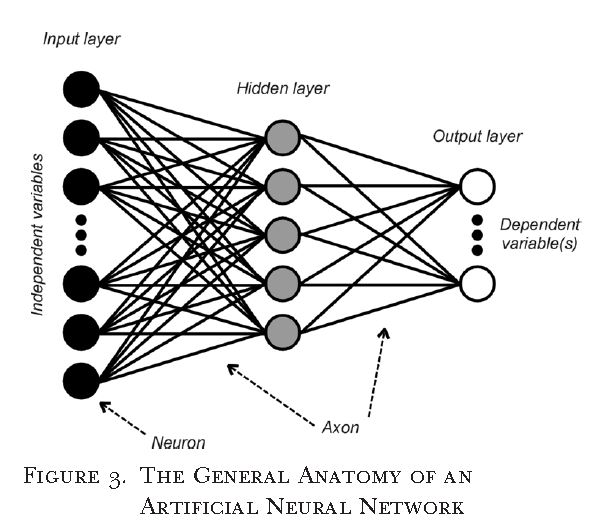
NeuralNetworks

Also known as multilayer perceptrons, artificial neural networks are considered to be the universal approximations of any continuous function. Neural networks are comprised of three primary components, input layer (independent variables), While there are different types of neural networks, this paper presented the feed forward network. In a feed forward network each neuron of the previous(layer) is connected to all neurons of the next layer via axons. Connections are weighted by an activation energy function. A core strength of neural networks is that many of the underlying features can be modified to suite the research task at hand. While a weakness to neural networks would be that model performance can be sensitive to random initial conditions (weights).

Genetic Algorithm or Genetic Programming
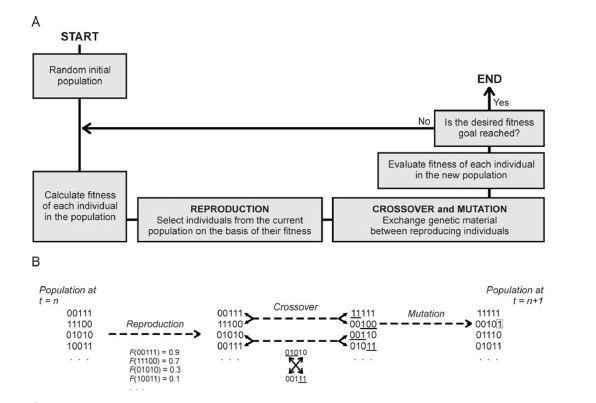
GeneticAlgorithms

The conceptual idea behind genetic programing is that algorithms operate in a population of competing solutions to one problem, and the best solution evolves over time. Solutions are comprised of chromosomes and the chromosomes are comprised of “genes”. Genetic algorithms are strong in handling stochastic optimization procedures, but are more susceptible to model overfitting.


Conclusion

The purpose of this paper was to provide ecologist and biologist with a basic introduction to machine learning techniques and how they can be applied to ecological problems. Authors stress that while machine learning techniques can be a major boon in ecological research, machine learning will not be a end all solution to problems facing ecology. Rather, machine learning approaches should be considered an alternative to problems in massaging messy data into classical statistical models.

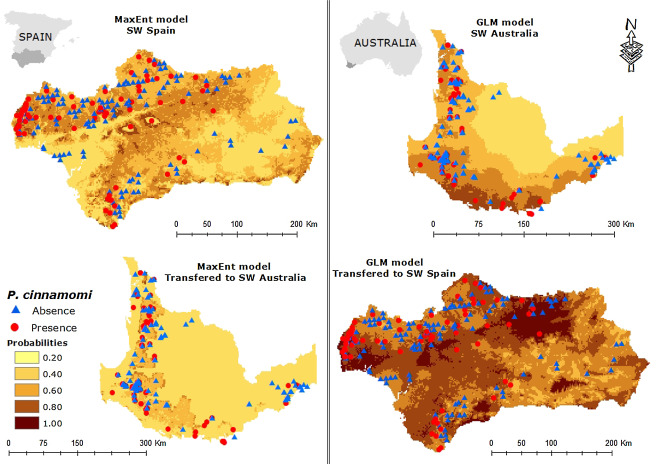
Transferability of species distribution models: The case of Phytophthora cinnamomi in Southwest Spain and Southwest Australia

model_projections_transferabilityDuque-Lazo, J., van Gils, H., Groen, T. A., & Navarro-Cerrillo, R. M. (2016). Transferability of species distribution models: The case of Phytophthora cinnamomi in Southwest Spain and Southwest Australia. Ecological Modelling, 320, 62-70.
DOI: 10.1016/j.ecolmodel.2015.09.019

Species distributions may be assessed through interpolation for contiguous/adjacent areas without species occurrence, extrapolation for a geographic range wider than the calibration area of the model, or transferring a model calibrated in one region or time period to a disjunctive region or to a different period. Transferability of SDMs can be helpful in assessing the impacts of climate change on biodiversity, but transferability performance of SDMs between two disjunctive areas is poorly understood. This paper seeks to determine if models that are locally highly accurate are also better when transferred to a disjunctive area, identify which SDM algorithm(s) achieve the best transferability accuracy, and if model transferability accuracies depend on the number of variables included in the analysis. Using presence data for a species found across the world, models were constructed separately for two different regions (Spain and Australia). Models trained and calibrated in Spain were transferred to Australia and vice-versa. The transferability accuracy was calculated as an accuracy index in which the accuracy of the model when transferred was divided by the accuracy of the model within its training region. Models trained in Spain resulted in higher AUC values than those trained within Australia. GAM and GLM models were best transferred across the continents, though MaxEnt was the most stable model when transferred. Models transferred to Spain were more accurate than those transferred to Australia. This difference in transferability between models trained in different regions may be due to differences in value ranges in environmental variables. To reduce this uncertainty it is recommended that both the similarity in the mean value of variables and the range of the variables values be standardized across regions. While models developed in Spain showed high predictive performance within the training area, this performance did not translate to high transferability; indicating that high predictive performance does not guarantee high transferability. GLMs performed well within both the training region and the disjointed region transferring in both directions, while MaxEnt performed well in both training regions, but only transferred well in one direction. The ability to apply models outside of the training extent may allow us to understand more about how climate change will influence biodiversity and species distributions in the future, but we must address the uncertainties presented by predicting on environments that contain vastly different distributions of environmental conditions when compared to the training region as this can influence the predictive performance of the model.

Maximum Entropy-Based Ecological Niche Model and Bio-Climatic Determinants of Lone Star Tick (Amblyomma americanum) Niche

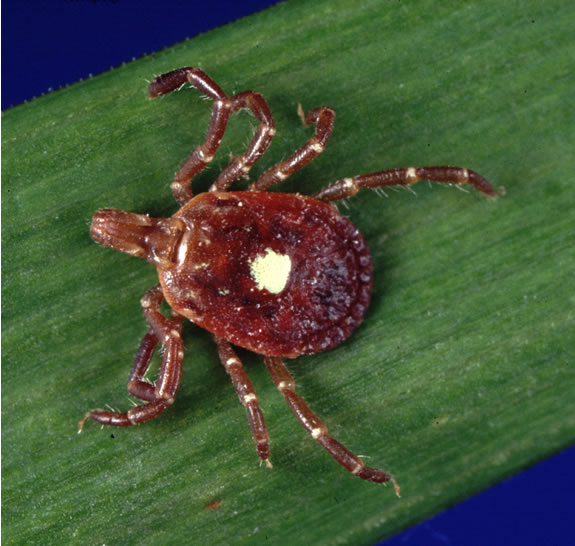
Amblyomma americanum, Lone Star tick, is capable of transmitting several human and zoonotic pathogens.  The species is currently (as of the paper, 2016) has a known distribution of the Southern and Eastern United States, with some eastern parts of Kansas within the range.  However, there is increasing evidence that the species is also located in western areas of Kansas and diseases caused by the transmittable pathogens also occurring.   The authors intend to update the predicted distribution of the species across the Kansas landscape using MaxEnt.

Amblyomma_americanum_tickFemale adult lone star tick (Amblyomma americanum)
Known occurrence data of the species was obtained from three sources providing historical and current surveys.  Environmental data was gathered from CliMond.  This set provides more data, such as soil moisture, that is more biologically relevant to the tick species.  To remove autocorrelation between predictor variables, the Band Collection Statistics tool (ArcGIS) was used to exclude pairs of highly correlated variables.  Lastly, PCA was used on the predictor CliMond variables and standardized components of a reduced dimensionality were used in the MaxEnt model.

From the results of the PCA, ~88% of the variation in the was explained by the first two principle components.  The first consisted mainly of soil moisture and temperature variables (61.4%) and the second consisting mostly of precipitation (26.4%).  The MaxEnt model resulted in a best fit AUC of 0.84.  The easternmost regions of Kansas provided the highest suitability of the species with a decrease going westward (Featured Image).  However, there are some regions in the west that are suitable for the species.  These results are of a wider range that currently(previously) predicted.  The authors then go into discussion how the climatic variables included in the model may affect the behavior/ecology of the ticks particularly interspecies interactions and questing behaviors. With this increase in potential range, the risk for pathogen transmission also becomes worrisome.  The authors close by commenting on the potential impact that climate change can have on the distribution/potential distribution of the species.

Raghavan, R. K., Goodin, D. G., Hanzlicek, G. A., Zolnerowich, G., Dryden, M. W., Anderson, G. A. & Ganta, R. R. 2016 Maximum Entropy-Based Ecological Niche Model and Bio-Climatic Determinants of Lone Star Tick (Amblyomma americanum) Niche. Vector-Borne Zoonotic Dis. 16, 205–211.

A synthesis of transplant experiments and ecological niche models suggests that range limits are often niche limits

“Elephants can’t cross oceans.”

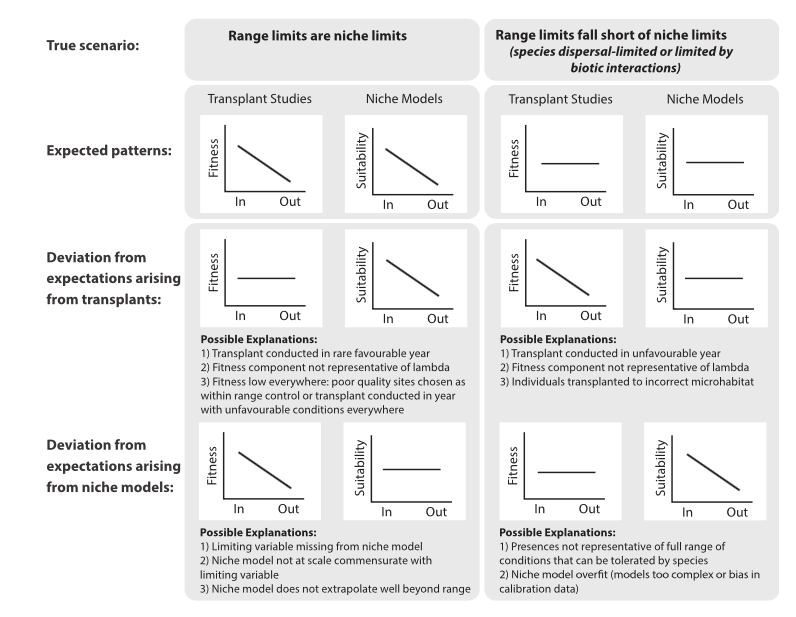
The focus of the paper is determining if dispersal limitations constrain the  range limits of a species rather than the abiotic and biotic conditions of an area.  This allows for a better understanding of the drivers of species distributions and traits that limit the range expansion. Transplant experiments and Ecological Niche models are used to examine if the range limits are also the niche limits of a species. If both of these approaches are appropriately designed, they should give very similar results to if the range limits are the same as the niche limits.  It is expected that both the studies and models would have a decline in fitness and suitability measures across the range limits (Featured Image).  However, if the species range is dispersal limited, there is no change in these two measures across the limits.  In the study, the authors surveyed the results of transplant studies of 40 species and built the ENM for each species (using MaxEnt).  To compare the results of each and determine if there is a decline in fitness and suitability across range limits, they generated linear mixed-effects models (independently).

For most species, a decline in fitness and suitability from sites inside the range to outside the range. However, overall there is a decline in both measures from sites inside to outside the limit. The authors highlight that these results support that the range limits of a species is also often the niche limit. Further, the dispersal of a species does not the range limit. Also, the authors point out that better designs of transplant experiments and ENM along with the combination of the two methods would lead to a better understanding if the range limit of a species is also the niche limit of the species.

The authors close by pointing out that outside influences (such as human interactions and dispersal limits) may cause the range limit to a subset of the niche limit.

Lee-Yaw, J. A., Kharouba, H. M., Bontrager, M., Mahony, C., Csergő, A. M., Noreen, A. M. E., Li, Q., Schuster, R. & Angert, A. L. 2016 A synthesis of transplant experiments and ecological niche models suggests that range limits are often niche limits. Ecol. Lett. (doi:10.1111/ele.12604)

Contemporary white-band disease in Caribbean corals driven by climate change

Randall, C.J. & van Woesik, R., 2015. Contemporary white-band disease in Caribbean corals driven by climate change. Nature Climate Change, 5(4), pp.375–379. linkScreen Shot 2016-04-22 at 4.21.25 PM

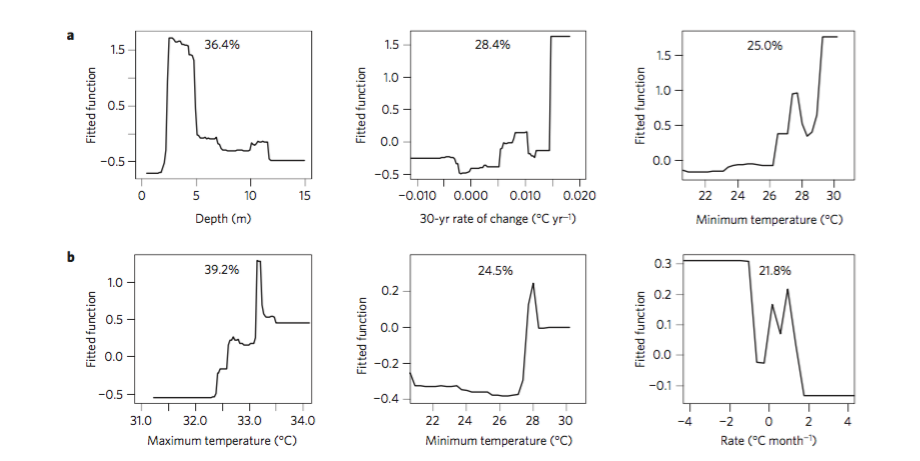
Populations of two dominant coral species, Acropora palmata and Acropora cervicornis, have declined more than 90% in the past 40 years. This decline is mostly attributed to white-band disease. Although other coral diseases have been linked to increases in sea surface temperature (SST), there is no definitive evidence for this in white band disease. To understand the response of white band disease to climate change related variables, the authors used boosted regression trees (BRTs), with presence and absence of disease data in a total of 473 coral colonies from 1997 to 2004. Stochasticity was incorporated into their models by bagging to fit each new tree and a k-fold cross-validation was used to train (90%) and test (10%) each model. The relative contribution of each predictor variable was estimated, and any interactions between predictor and variables were examined. Their models performed well for both species, with AUCs of 0.85 and 0.72. For both species, a rise in minimum SST seemed to play a role in the increase in white-band disease. For one of the species, the rate of increase in SST over the past 30 years showed a steep rise in relative contribution to prediction of white band disease after about 0.015 degrees C per year. Since global models predict a mean increase in SST of .027 C per year from 1990 to 2090, many reefs currently without white-band are likely to have disease in the future.

Harnessing the World’s biodiversity data: promise and peril in ecological niche modeling of species distributions

Anderson, Robert P. “Harnessing the world’s biodiversity data: promise and peril in ecological niche modeling of species distributions.” Annals of the New York Academy of Sciences 1260.1 (2012): 66-80.

DOI: 10.1111/j.1749-6632.2011.06440.x

The advances in stores of biological and environmental data (presence-only data) from museums facilitate species niches and geographic distribution modeling, which offers key insights for conservation biology, management of invasive species, zoonotic human disease, and other pressing environmental problems. However, the full utility of niche modeling remains under-realized, which mainly lies in both the incomplete availability of the occurrence data (1, incorrect taxonomic identifications; 2, lacking or inadequate databasing and georeferences; 3, effects of sampling bias across gepgraphy) and the nascent nature of the field, with few researchers well trained conceptually and methodologically (i.e. 4, selection of the study region; and 5, model evaluation to identify optimal model complexity). The authors highlighted that the critical applications of museum data via SDM represent an opportunity for museums to contribute information and solutions to key societal issues, as well as a compelling justification for investment in the taxonomic studies of biodiversity. The selection of the study region for model calibration represents a topic of great importance. Studies show that environmental data from regions that may hold suitable conditions but in which the species is absent for other reasons should not be included in background samples. To be specific, the absence may be due to dispersal barriers or because biotic interactions. Although limited numbers of studies take into account paramount principles of study-region selection and extrapolation in environmental space, they have been stated clearly in literature. Finally, researchers should elaborate good performance for SDM before interpreting and using them for applications, including whether the model predicts independent data well and whether it has the ability to predict across time and/or space. The author claimed for a necessity to produce a much larger number of scientists capable of building and applying high-quality SDM, as well as a broad community able to acknowledge their quality and utility. I highly agree with the author that SDM is on its way to thrive and making practical contributions for biodiversity studies. One of the first-hand experiences I have during this semester is that there are still barriers between researchers from different traditional “disciplines”, both in understanding of theory or technology. Epitomizing the interdisciplinary nature of the field is critical to promote further development of SDM and biodiversity informatics.

Selecting thresholds for the prediction of species occurrence with presence-only data

Liu, C., White, M., & Newell, G. (2013). Selecting thresholds for the prediction of species occurrence with presence-only data. Journal of Biogeography, 40(4), 778–789. http://doi.org/10.1111/jbi.12058


Many of the newer methods for SDM output continuous values, but binary predictions are often needed in application and when evaluating models, necessitating the need for thresholding. Many thresholding techniques have been proposed, such as lowest presence threshold, fixed thresholding, and minimizing or maximizing a the difference between opposing statistics, but there is no consensus on which performs better, and presence-only data can not be used in all of these instances. Liu et al (2013) compared 12 different techniques through mathematical proofs and simulations of species distributions. First, they use mathematical proofs to show that only eight of the techniques will result in similar thresholds using presence-only and presence-absence (or pseudo-absence) data. They then use 1000 simulated data sets of species occurrences to evaluate the variation within each thresholding technique, based on eight modeling approaches: Mahalanobis distance, ecological niche factor analysis, and GAM and random forest, the final two which each had three models using presence/absence, presence/pseudo-absence, and presence/psuedo-absence filtered with Mahalanobis distance. They choose four techniques (max kappa, min D01, meanPred, and max SSS) to evaluate. To sum up their (many) results, max SSS (which maximizes the sum of sensitivity and specificity) was most robust to pseudo-absences and changes in species prevalence, meaning it had less variation in its threshold definition as those parameters changed. When evaluated on the criteria of objectivity, equality, and discriminability, it performed better than the other methods because it is objective, unaffected by pseudo-absences, and produced higher sensitivity and specificity than other methods. All of the thresholding methods, however, are influenced by sampling bias in environmental space, especially as the sample size decreases. Based on all of the caveats to thresholding, I think it would be best to avoid doing unless absolutely necessary or to offer results based on multiple thresholds. When this is unavoidable, max SSS will perform the best.

Statistical solutions for error and bias in global citizen science datasets

Bird, T. J., Bates, A. E., Lefcheck, J. S., Hill, N. A., Thomson, R. J., Edgar, G. J., et al. (2014). Statistical solutions for error and bias in global citizen science datasets. Biological Conservation, 173(C), 144?154. http://doi.org/10.1016/j.biocon.2013.07.037


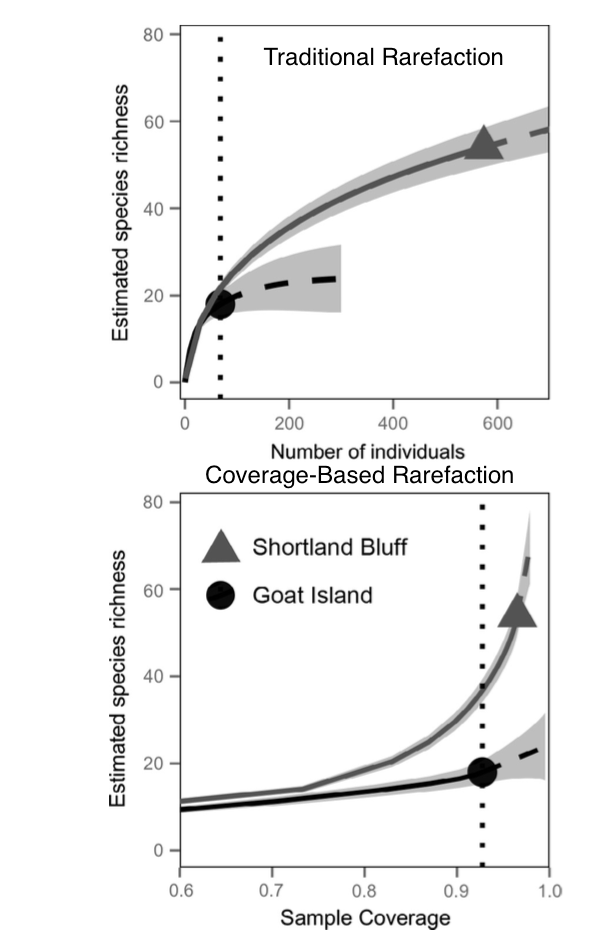
Citizen science has been gaining traction because of its ability to be both an outreach and data collection tool, however there is a serious concern about bias in the data. This bias can be avoided by implementing trainings and stricter sampling protocols, or through statistical processes more often used to correct sampling bias in SDM. The primary issues in citizen science data are greater variability and sampling bias. Fortunately, many of the same statistical methods for accounting for bias in normally gathered occurrence data can be used for citizen science data. We’ve discussed many of them in more detail in class, so I will only focus on the more novel techniques. One method they recommend is accounting for variation between surveyor’s skill levels or biases by using mixed-effects models where surveyor identification is a random effect. Because citizen science data is usually less sparse than normal occurrence data, another common technique is to use an occupancy-detection model, which is based on other citizen scientists’ data. Similarly, when calculating biodiversity or species richness, you can account for under sampling by using a measure of sample “completeness”, similar to conventional rarefaction curves, but which extrapolate species richness before limiting the samples, resulting in higher species richness measures (see Figure). While these statistical methods allow for some correction, they can not completely correct for bias in citizen science data as well as proper training of volunteers and protocols. AS citizen science becomes more well-used, a field of comparing citizen science data to expert data is growing, which will hopefully be able to inform and better design citizen science experiments to mitigate these issues from the beginning.

for blog

Plants’ native distributions do not reflect climatic tolerance

Bocsi, Tierney, et al. “Plants’ native distributions do not reflect climatic tolerance.” Diversity and Distributions (2016).

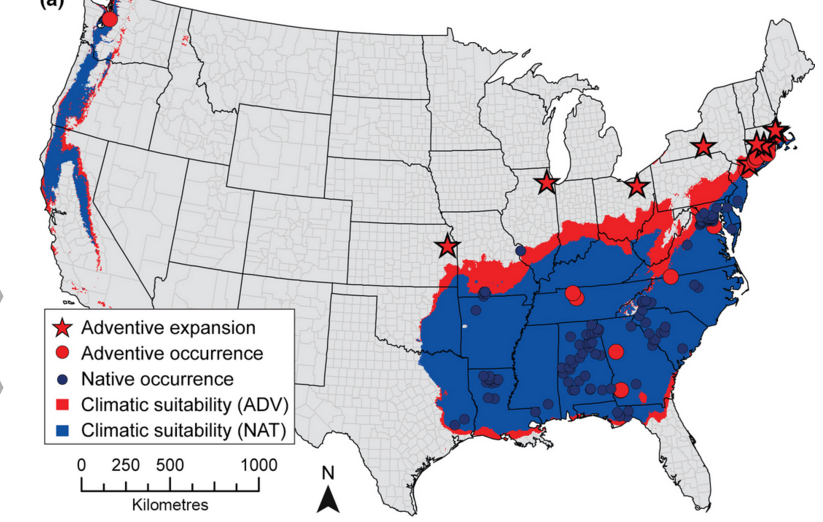
This paper is related to the last one I posted on in that it argues that a core assumption of species distribution models is violated, and that this violation could influence the applicability of species distribution models. The often-violated assumption is that of range equilibrium, and the full exploitation of environments which the species can persist. That is, the assumption that species occurrences in space capture niche boundaries. To address how often species can persist outside of their predicted niche boundaries, the authors used data on 144 US plants that occurred in their native range, and that were introduced through ornamental use (“adventive”).  They Googled plant names + “garden” or “for sale” to determine if the plant was ornamental. They pulled county-level data from multiple sources, including GBIF, and a bunch of herbaria, arguing that herbarium collections identify the native range, and the Biota of North America Program (BONAP) to get at adventive occurrences outside of the native range. The authors trained MaxEnt models on each species in both native and native+adventive ranges on 3 variables (annual precipitation, minimum January temperature and maximum July temperature). The data needed to consist of at least 10 native occurrence points, and at least 1 adventive point. The authors found that the inclusion of adventive occurrences expanded the predicted suitable geographic range for 86% of the species examined. There was a negative relationship between the size of the native range and the amount of niche expansion. Model accuracy was high on average (> 0.9 ), and was consistently higher for models trained on only the native occurrence points. The authors claim that the increase in the size of the geographic range as a function of including adventive occurrences is evidence that the assumption that occurrence points represent the realized niche is overly optimistic.

No‐analog climates and shifting realized niches during the late quaternary:

Veloz, Samuel D., et al. “No‐analog climates and shifting realized niches during the late quaternary: implications for 21st‐century predictions by species distribution models.” Global Change Biology 18.5 (2012): 1698-1713.

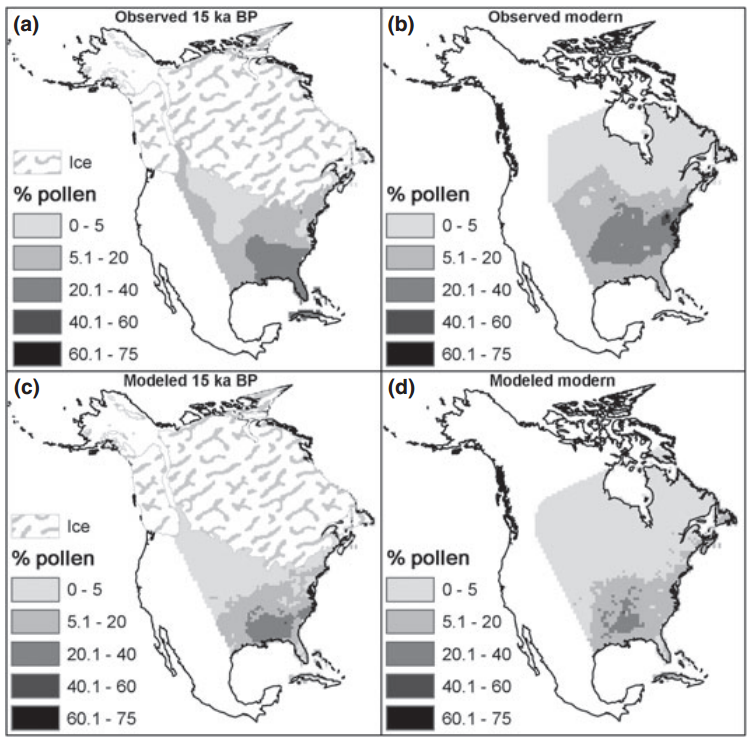
Species distribution models are often used to predict species range shifts as a function of climate change. However, the authors argue that some of the core assumptions of species distribution models are violated when attempts are made to project species distributions into some climate change scenarios in which there are no-analog environments (i.e., those present in the future but not present now). This is because the models do not model the fundamental niche, but instead the realized niche given the data. Dispersal limitation or the absence of an environment at the margin of a species niche could cause this niche underfilling that would bias SDM predictions. To address this, the authors examine the performance of five species distribution models (SDMs) and two ensemble models trained on fossil pollen data from North America. Further, the authors measure niche overlap as a function of time (1, 8, 15 ka BP) for the set of 20 taxa considered, providing evidence for significant climatic niche shifts in 70% of species. The authors place many of the SDM accuracy results in the supplement, and focus on the estimated niche shift aspect. What I find most strange is that authors discuss the niche in such detail in the introduction, and argue that species distribution models may not capture the niche for a list of reasons, setting up themselves to address if/when SDMs can predict the niche when climate changes. However, the authors choose to model relative abundance of pollen as the data given to the niche models, instead of occurrence data. This strikes me as strange for two reasons. First, pollen could be in an area where the plant is unlikely to grow, or may not even be viable, and therefore doesn’t really represent the plant niche at all. Second, species distribution models typically use binary data (presence-absence) to estimate the niche. The ability to predict relative abundance is 1) dependent on other species present (other species aren’t considered in the traditional niche concept), and 2) not really the aim of species distribution models generally. Perhaps I’m just being obtuse though.